How to Calculate Return on Ad Spend: Boost Campaign Profits
To calculate your Return on Ad Spend (ROAS), you just need one simple formula:
Total Revenue from Ad Campaign / Total Cost of Ad Campaign
This little equation tells you exactly how much cash you're generating for every single dollar you put into your ads. It's the ultimate measure of whether your advertising is actually profitable.
Why ROAS Is Your Most Important Ad Metric
Before you get lost in spreadsheets and dashboards, let's get one thing straight. Return on Ad Spend isn't just another bit of marketing jargon; it’s the clearest signal you have to tell if your ads are making you money or just costing you.
Think of it like this: for every dollar you feed into your advertising machine, how many dollars does it spit back out? A high ROAS means you've built an efficient money-making machine. A low one? It’s time for a tune-up.
The Power of a Simple Calculation
Getting this calculation right is non-negotiable for any business that's serious about growth.
Let's say you spend $10,000 on a Google Ads campaign and it brings in $50,000 in sales directly attributed to those ads. Your ROAS is a solid 5.0, which means you earned $5 for every $1 you spent. It’s a beautifully simple way to cut through the noise. If you want to dive deeper, you can always explore more definitions of key advertising KPIs.
Nailing this one number gives you the power to:
- Make Smarter Budget Decisions: You can confidently pump more money into campaigns that are actually delivering a strong return and pull the plug on the ones that aren't.
- Scale Your Winners: Found a campaign that's killing it? Now you can scale it up without just guessing, because you have hard data to back up your decision.
- Prove Marketing's Value: Stop having vague conversations about "brand awareness." Instead, you can walk into a meeting and clearly show the financial impact of your ad campaigns to your boss, clients, or stakeholders.
ROAS shifts your advertising from being just another expense to a measurable, high-yield investment. It changes the entire conversation from "How much did we spend?" to "How much did we earn?"
At the end of the day, knowing how to calculate your return on ad spend is all about checking the pulse of your advertising strategy. It gives you the clarity you need to stop wasting money and start investing in what truly grows your business. It's the first real step toward building a marketing engine that's both sustainable and profitable.
Gathering the Right Data for an Accurate ROAS

Any ROAS calculation is only as good as the data you feed it. We've all heard the classic "garbage in, garbage out" saying, and it's a huge risk here. If you're not careful, you could end up making critical budget decisions based on completely flawed numbers.
Getting this right means you have to dig deeper than the surface-level metrics your ad platforms spit out.
Your starting point is defining your Total Ad Cost. And no, this isn't just what you paid Google or Meta for the clicks. To get a true, honest picture of your investment, you need to account for all the related expenses.
Accounting for All Your Costs
Your ad spend is so much more than just the platform fees. For a truly precise ROAS calculation, you have to include every single dollar that supports your campaigns. Think about these costs that often get overlooked:
- Agency or Freelancer Fees: That monthly retainer or commission you pay for expert campaign management.
- Creative Production: The money spent designing graphics, writing killer ad copy, or shooting and editing video content.
- Software and Tools: Don't forget the monthly subscriptions for analytics, bidding, or reporting tools. Many agencies use specialized Google Ads management software to pull all this data together efficiently.
- Affiliate Commissions: Any payouts you give to partners who drive sales through your ads.
If you skip these costs, you'll artificially inflate your ROAS. This is dangerous because it can make unprofitable campaigns look like absolute winners on paper.
Nailing Revenue Attribution
Getting your costs right is half the battle. The other half is accurately attributing revenue back to your ads, and this is where so many businesses get tripped up.
Are you still using a last-click attribution model? It's the default setting for a reason—it's simple. But it gives 100% of the credit to the very last ad a customer clicked before converting, completely ignoring every other touchpoint that nudged them along the way.
This is incredibly misleading. Imagine a customer sees a Facebook ad, later reads a blog post from a Google search, and then finally buys after clicking a retargeting ad. The last-click model would give all the credit to that final ad, making the Facebook ad and blog post seem worthless. They weren't.
A multi-touch attribution model gives you a much more realistic picture. It works by distributing credit across the multiple touchpoints in a customer's journey. This helps you understand the full impact of your advertising, not just the final click that closed the deal.
Of course, none of this matters if your tracking is broken. Ensuring your pixels are installed correctly is fundamental. For example, properly tracking Facebook ads is non-negotiable for capturing accurate conversion data from the source. Clean data from your ad platforms, combined with a smart attribution model, creates a ROAS figure you can actually trust.
Putting The ROAS Formula Into Practice
Alright, theory is great, but let's get our hands dirty. The best way to really get a feel for the ROAS formula is to see it in action with some real-world numbers. We'll walk through two completely different business models to show you just how flexible this metric is.
This is all you need to remember: you're just taking the money you made and dividing it by the money you spent.
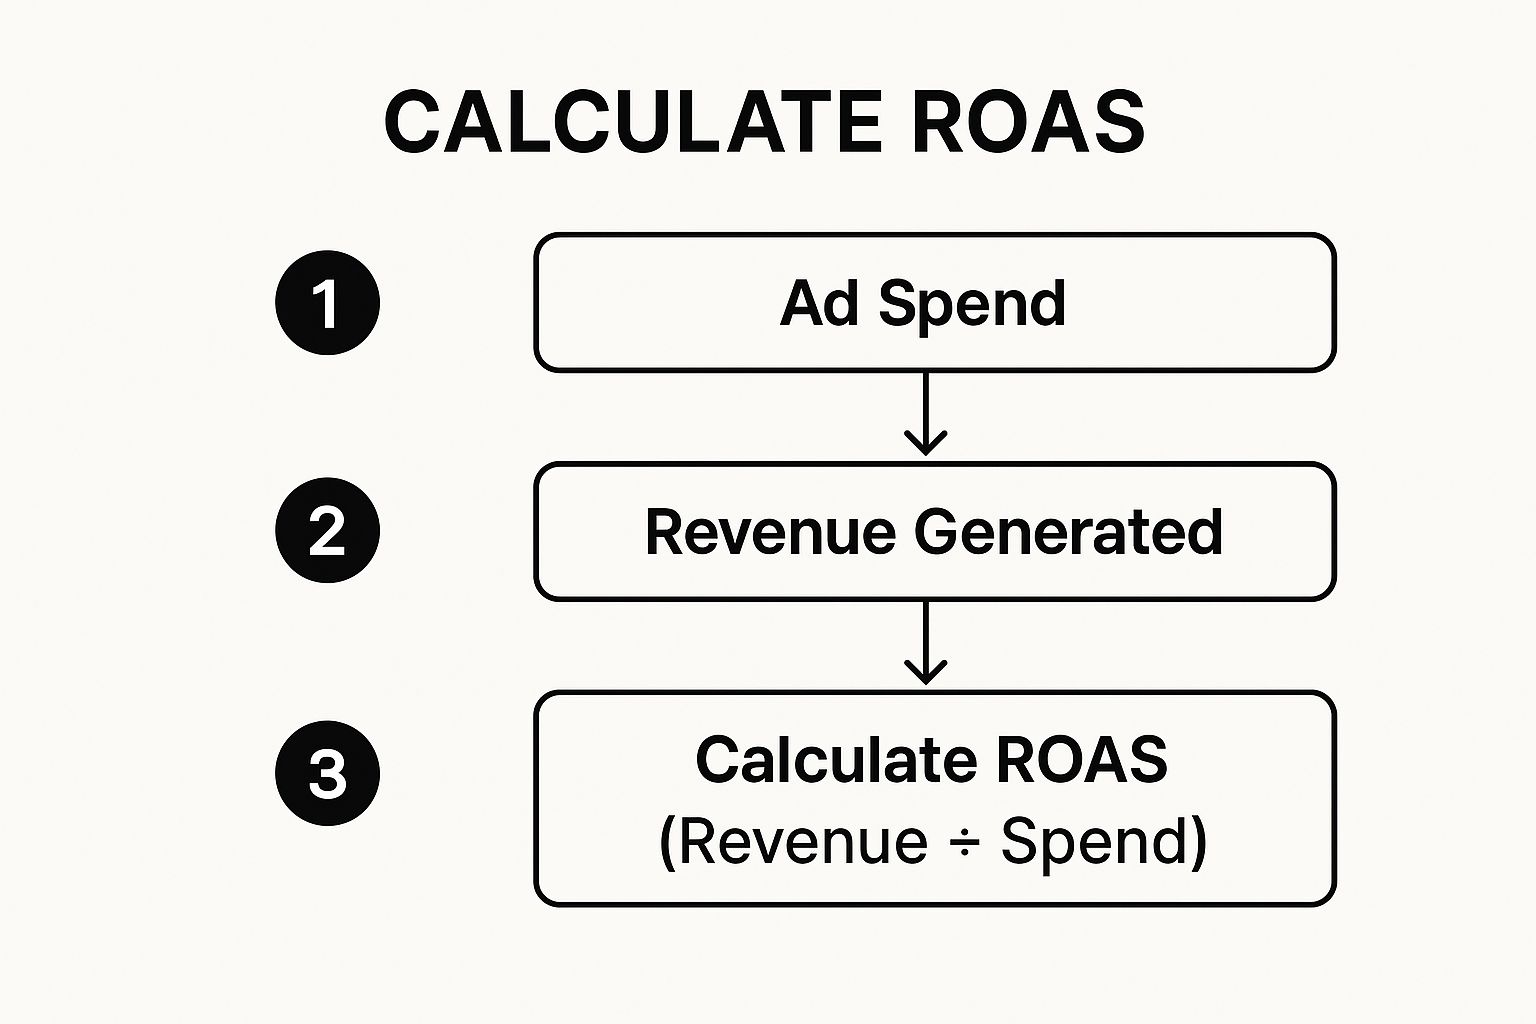
It really is that simple. You divide the total revenue your ads generated by what you paid for those ads, and that gives you your ROAS.
E-Commerce Coffee Brand Scenario
Let's start with an online store selling premium coffee beans. They decide to run a targeted Meta ad campaign to push a new espresso blend.
Here’s how their numbers shake out:
- Total Ad Cost: $2,500. This isn't just the ad spend itself. It includes the $2,200 they paid Meta plus $300 for a freelance designer to create the ad visuals.
- Revenue from Campaign: $10,000. This was tracked directly through their e-commerce platform's attribution.
Now, we just plug those into the formula:
$10,000 (Revenue) / $2,500 (Ad Cost) = 4
The coffee brand ended up with a ROAS of 4:1. For every $1 they put into the campaign, they got $4 back in revenue. In the e-commerce world, that's a pretty solid return. For a more detailed breakdown of these types of calculations, check out a comprehensive guide on how to calculate ROAS.
B2B Software Company Scenario
Things get a little different for a B2B SaaS company. Their ads don't drive direct purchases; they’re designed to get people to sign up for a demo. This means we have to add an extra step: figuring out what a lead is actually worth.
After digging into their historical data, they know that 1 out of every 5 demo requests turns into a paying customer. They also know their average customer lifetime value (CLV) is $5,000.
Lead Value = (Conversion Rate) x (Customer Lifetime Value)
Lead Value = (0.20) x ($5,000) = $1,000
So, each demo request is worth $1,000 to them. Now they can calculate the ROAS from their latest Google Ads campaign.
- Total Ad Cost: $8,000
- Leads Generated: 32 demo requests
- Total Lead Value: 32 leads x $1,000/lead = $32,000
Let's do the math:
$32,000 (Total Lead Value) / $8,000 (Ad Cost) = 4
Just like the coffee brand, this B2B company also hit a 4:1 ROAS.
ROAS Calculation In Different Business Scenarios
Seeing these examples side-by-side really highlights how the same core formula applies, even when the business goals are totally different. It all comes down to correctly identifying your "return" and your "ad spend."
| Business Scenario | Total Ad Cost | Revenue or Lead Value | The ROAS Calculation | Final ROAS Figure |
|---|---|---|---|---|
| E-Commerce Store | $2,500 | $10,000 in direct sales | $10,000 / $2,500 | 4:1 |
| B2B Lead Gen | $8,000 | $32,000 in estimated lead value | $32,000 / $8,000 | 4:1 |
As you can see, whether you're selling a product or a service, the fundamental approach to measuring your ad effectiveness remains the same.
Keeping all these numbers straight can get messy, especially when you're running multiple campaigns. Using a dedicated marketing campaign tracking spreadsheet is a lifesaver for keeping all your cost and revenue data organized in one place. These examples prove that no matter your business, the core formula always works.
So, What's a Good ROAS, Really?

Alright, you've crunched the numbers and have a ROAS staring back at you. Now what? This is where the real strategy begins, and it's also where one of the most common questions in marketing pops up: "What is a good ROAS?"
The honest answer? It completely depends on your business.
A 3:1 ROAS could be fantastic for a SaaS company with 80% profit margins. But for an e-commerce store with tight margins, high shipping costs, and a ton of overhead, that same 3:1 could be a fast track to going broke. The often-quoted 4:1 ROAS benchmark is a decent starting point, but it's far from a universal rule.
Stop chasing arbitrary industry benchmarks. The only "good" ROAS is one that's profitable for your specific business model. The most important figure you can calculate isn't someone else's target—it's your own break-even point.
Finding Your Break-Even ROAS
To figure out your profitability threshold, you need to know your profit margin. It’s that simple.
If your profit margin is 25%, you need to earn $4 for every $1 you spend just to cover your costs (1 / 0.25 = 4). That means your break-even ROAS is 4:1. Anything above that is pure profit.
Let's look at a few more examples:
- Profit Margin of 50%: Your break-even ROAS is 2:1.
- Profit Margin of 20%: Your break-even ROAS is 5:1.
Suddenly, ROAS isn't just a vanity metric; it’s a powerful diagnostic tool. It tells you exactly where the goalposts are for making money. And these goalposts can shift dramatically by market. As Statista's data on global advertising ROI shows, performance varies wildly from one region to another, reflecting these complex dynamics.
This level of detail is also why attributing value correctly is so critical. To get an accurate profit picture, you have to know which touchpoints actually led to a conversion. If you haven't already, it's worth taking a moment to understand what marketing attribution is and how different models can change your revenue data.
Once you know your break-even point, you can finally set realistic campaign targets and make smart decisions that directly grow your bottom line.
Common ROAS Mistakes That Skew Your Numbers
Even the sharpest marketers can fall into traps that make their ROAS data seriously misleading. Getting the final number is easy enough, but getting an accurate number means you have to sidestep a few common pitfalls that can quietly sabotage your budget decisions.
One of the most frequent errors I see is relying only on last-click attribution. This model gives 100% of the credit to the final ad a customer clicked before buying, completely ignoring the entire journey that came before it.
Think of it this way: it’s like giving all the credit for a touchdown to the player who carried the ball over the line. What about the blockers and the quarterback who made the play happen? This skewed view almost always leads marketers to undervalue top-of-funnel campaigns that are absolutely essential for building awareness.
Are You Factoring in All Your Costs?
Another critical mistake is forgetting to account for every single advertising cost. It’s tempting to just pull the ad spend number directly from your platform’s dashboard, but that paints a deceptively rosy picture.
Forgetting to include costs like agency fees, creative production, or software subscriptions artificially inflates your ROAS. This can make an unprofitable campaign look like a winner, encouraging you to pour more money into a losing strategy.
Looking Beyond ROAS Alone
Focusing exclusively on ROAS creates tunnel vision. While it's a vital metric for measuring how efficient a campaign is, it doesn't tell the whole story about your business's health. For instance, a campaign with a lower ROAS might be bringing in customers with a much higher Customer Lifetime Value (CLV).
If you ignore metrics like CLV, you might pause a campaign that’s actually building long-term, sustainable profitability. Instead, you'd be chasing a short-term gain from a different campaign. The real goal is to build a healthy business, not just hit a high ROAS for a single month.
The pressure to prove campaign effectiveness is intense, I get it. Especially when you consider that global digital ad spend has shot up from $243.1 billion to nearly $679.8 billion in just six years. You can explore more data on digital advertising growth to see just how crowded the space has become, making accurate measurement more critical than ever.
Ultimately, ROAS is most powerful when it’s part of a balanced scorecard. When you look at it alongside metrics like CLV and cost per acquisition, you get a far more complete and trustworthy picture of your marketing's real impact.
ROAS FAQs: Your Questions Answered
Once you start digging into Return on Ad Spend, a few questions always come up. Let's clear the air on some of the most common ones so you can go from just tracking a number to really understanding what it means for your strategy.
What’s The Difference Between ROAS and ROI?
This is a big one. Think of it this way: ROAS is a laser-focused metric, while ROI is the big picture.
Return on Ad Spend (ROAS) zooms in on your ad campaigns. It tells you how much revenue you're generating for every single dollar you put into advertising. It’s the perfect metric for answering the question, "Is this specific ad campaign actually working?"
Return on Investment (ROI), on the other hand, is much broader. It measures the total profitability of a business effort by looking at all the costs involved—not just ad spend, but also things like software, salaries, and overhead. ROI tells you if an entire initiative was a smart business move.
In short: ROAS measures the effectiveness of your ads. ROI measures the profitability of your entire business strategy.
Which Attribution Model Is Best for Tracking ROAS?
For the most accurate ROAS numbers, a multi-touch attribution model is almost always the way to go.
Why? Because single-touch models (like last-click) give 100% of the credit to the very last ad someone clicked. We all know that's not how the real customer journey works. People see multiple ads, read a few emails, and maybe click a social post before they finally buy.
A multi-touch model shares the credit across all those different touchpoints. This gives you a much more realistic view of how your ads work together to drive a sale. It also prevents you from mistakenly cutting the budget for an ad that's doing critical work at the beginning of the funnel.
How Often Should I Calculate ROAS?
This really depends on your business's rhythm and sales cycle. There's no single right answer.
- For fast-paced e-commerce brands: You'll probably want to check your ROAS weekly, or maybe even daily. This lets you spot trends and tweak your campaigns in near real-time before you waste any budget.
- For B2B companies or anyone with a longer sales cycle: Calculating monthly or quarterly makes more sense. Daily blips won't mean much, and you need to give your leads enough time to actually become paying customers.
Whatever you choose, the most important thing is to be consistent. Tracking ROAS over time is how you'll spot what’s working, what isn't, and whether your advertising is getting more efficient.
Ready to stop manually downloading leads and start responding to them instantly? LeadSavvy Pro automates your entire Facebook lead capture process, syncing new prospects directly to your Google Sheet or CRM. Start for free and streamline your workflow today.

