How to Calculate Cost Per Lead a Practical Guide
Here's the simple truth: your Cost Per Lead (CPL) is just your total marketing spend divided by the total number of new leads you generated. It's the one number that tells you how efficiently your campaigns are working, and it's ground zero for optimizing your budget.
Your Quick Guide to Calculating Cost Per Lead
Knowing how to calculate your CPL is non-negotiable for any marketer trying to prove their worth. It's what separates guessing from making smart, data-driven decisions that actually grow the business.
The formula itself is dead simple, but its real power comes from how accurately you track the inputs.
Think of it this way: your final CPL is only as reliable as the numbers you plug in. If you only count your ad spend, you're missing a massive piece of the puzzle. The same goes for your definition of a "lead"—if it's too broad, your results will be completely skewed and basically useless.
This guide will give you a rock-solid foundation for the CPL calculation. Before we get into the weeds of tracking every hidden cost or debating lead quality, you have to nail the basics. Mastering this simple concept is how you:
- Justify your marketing budget with cold, hard performance data.
- Pinpoint your most efficient channels so you can double down on what works.
- Set a baseline to measure the success of all future campaigns against.
CPL Calculation at a Glance
To get started, it helps to see the components broken down. This table lays out the core formula with a simple, practical example.
| Component | What It Includes | Simple Example |
|---|---|---|
| Total Marketing Spend | The full cost of running your campaign. This includes ad spend, creative costs, software fees, and salaries. | $10,000 |
| Total New Leads | The number of qualified contacts generated by that specific campaign. | 50 Leads |
| Cost Per Lead (CPL) | The final calculation: Total Spend / Total Leads | $200 |
This gives you a clear, repeatable framework. Plug in your own numbers, and you've got your starting point for analysis.
The Core Formula in Action
At its heart, the calculation is just simple division.
Let's say your company drops $10,000 on a LinkedIn campaign that brings in 50 leads. Your CPL is $200.
Now, compare that to spending $5,000 on Google Ads that generates 100 leads. The CPL there is only $50—a far more efficient result. It's this kind of comparison that helps you make smarter budget decisions next quarter. You can dive deeper into various CPL calculation methods over at Leads at Scale.
A low CPL isn't always the ultimate goal. The real measure of success is whether the cost to acquire a lead is significantly lower than the value that lead eventually brings to your business.
This foundational knowledge is the key to unlocking much deeper insights. Once you understand how to calculate cost per lead accurately, you've turned a simple metric into a powerful tool for strategic growth.
Uncovering Your True Marketing Spend

So, you want to calculate your Cost Per Lead. The first mistake I see people make is looking only at their monthly ad spend on platforms like Google or Meta. That's a surefire way to get a number that looks great on paper but tells you absolutely nothing about your actual performance.
To get a CPL that's even remotely accurate, you need to hunt down every single dollar you invested in generating those leads. This includes all the hidden or "soft" costs that are so easy to forget. Sticking to just the ad budget gives you a misleadingly low CPL and a false sense of security.
The truth is, a successful campaign is an ecosystem of costs.
Beyond the Ad Budget
Your total marketing spend is a sum of many parts, and each one is critical for attracting and converting leads. Miss one, and your math is off. A truly comprehensive cost list includes both the obvious and the not-so-obvious.
Here’s what you absolutely must be tracking:
- Platform Ad Spend: This is the easy one. It’s the money you pay directly to Google, LinkedIn, Meta, TikTok, or wherever you're running ads.
- Creative and Content Production: Did you hire a freelance copywriter? A graphic designer for the ad visuals? A video editor? All those fees count.
- Software and Tool Subscriptions: Think about your tech stack. The monthly cost of your CRM, marketing automation platform, and any analytics tools are part of the equation.
- Human Resources: This one gets missed a lot. A chunk of your marketing team's salaries needs to be allocated here. If a team member spends 25% of their time managing a campaign, then 25% of their salary for that period is a campaign cost. Simple as that.
Factoring in Every Detail
A precise CPL isn't just about paid ads. It's about pulling in those softer costs like content creation, CRM tools, and even consulting fees. If you ignore these, you're misrepresenting how cost-effective your campaigns really are.
For example, don't forget the resources that went into building your conversion assets. We all know the importance of effective landing pages, and the time and money spent creating them are absolutely part of your total spend. If it helped turn a prospect into a lead, it has a cost.
This is where a solid grasp of marketing attribution becomes non-negotiable. It's the only way to connect all these scattered costs back to the specific campaigns that are actually delivering leads. For a deeper dive, check out our guide on what is marketing attribution: https://leadsavvy.pro/post/what-is-marketing-attribution/
By adopting this detailed approach, your "Total Marketing Spend" figure becomes a real, honest reflection of your investment. This accuracy is the foundation for a CPL you can trust to make smart budget decisions, ensuring every dollar is accounted for and working as hard as possible.
What a "Lead" Actually Means to Your Business
Before you can even think about calculating your cost per lead, we need to get on the same page about what a "lead" actually is. This sounds basic, but it’s where most businesses trip up.
If you’re lumping every interaction together—from a casual newsletter signup to a hot-and-ready demo request—you’re going to completely distort your CPL. It's like trying to measure distance with a rubber band; the numbers you get back will be totally useless for making smart decisions.
So, let's get specific. Is a lead someone who downloaded a whitepaper? Or is it someone who filled out a detailed form asking for a price quote? These two people have vastly different levels of interest, and they absolutely cannot be treated the same in your calculations.
MQL vs. SQL: The Distinction That Really Matters
Okay, let's cut through the jargon. The most critical distinction you need to make is between a Marketing Qualified Lead (MQL) and a Sales Qualified Lead (SQL).
Mixing these two up is a classic mistake, and it renders your CPL data almost meaningless. Getting this right is fundamental.
- Marketing Qualified Lead (MQL): Think of this as someone dipping their toes in the water. They've engaged with your marketing—maybe downloaded an ebook or subscribed to your blog—but they're not ready for a sales call. They’ve shown interest, but the buying intent is still pretty low.
- Sales Qualified Lead (SQL): This is the real deal. This person has taken a high-intent action that screams, "I'm interested in buying!" They've requested a demo, asked for a quote, or started a free trial. This is a lead your sales team can jump on right now.
Here's why this matters so much. You might calculate your cost per MQL and find it's a tidy $25. Looks great on a spreadsheet, right? But what if it takes 20 of those MQLs to get just one person to raise their hand for a sales conversation?
Suddenly, your true cost per sales-ready lead (your SQL) is actually $500. That context changes everything.
Make Sure Your Tracking is Flawless
Once you’ve defined your lead types, you need a bulletproof system to count them accurately. This is where the rubber meets the road, ensuring the "Total New Leads" part of your formula is spot-on.
First, you need to set up specific conversion goals inside your analytics tools, like Google Analytics. A "lead" can't just be a random page view; it has to be a concrete action, like a form submission. You should have a unique conversion goal for each lead type (MQL vs. SQL).
Next up: UTM parameters. Use them on every single link in every single campaign. It's a simple practice that tags each visitor with their source, medium, and campaign, letting you trace every lead back to the exact marketing effort that brought them in.
Honestly, without meticulous tracking, you're just guessing where your leads come from. Getting your goals and UTMs right is non-negotiable if you're serious about calculating a CPL that actually helps you grow.
Real-World CPL Calculation Scenarios
The theory behind calculating cost per lead is one thing, but seeing the formula in action is where it all clicks. Abstract numbers on a spreadsheet don't mean much until you connect them to real campaigns with real goals. So, let's walk through a couple of detailed examples to show how CPL works in completely different business worlds.
A simple visual can really help frame this. The bar chart below breaks down a basic campaign, showing the direct relationship between what you spend, how many leads you get, and the resulting CPL.
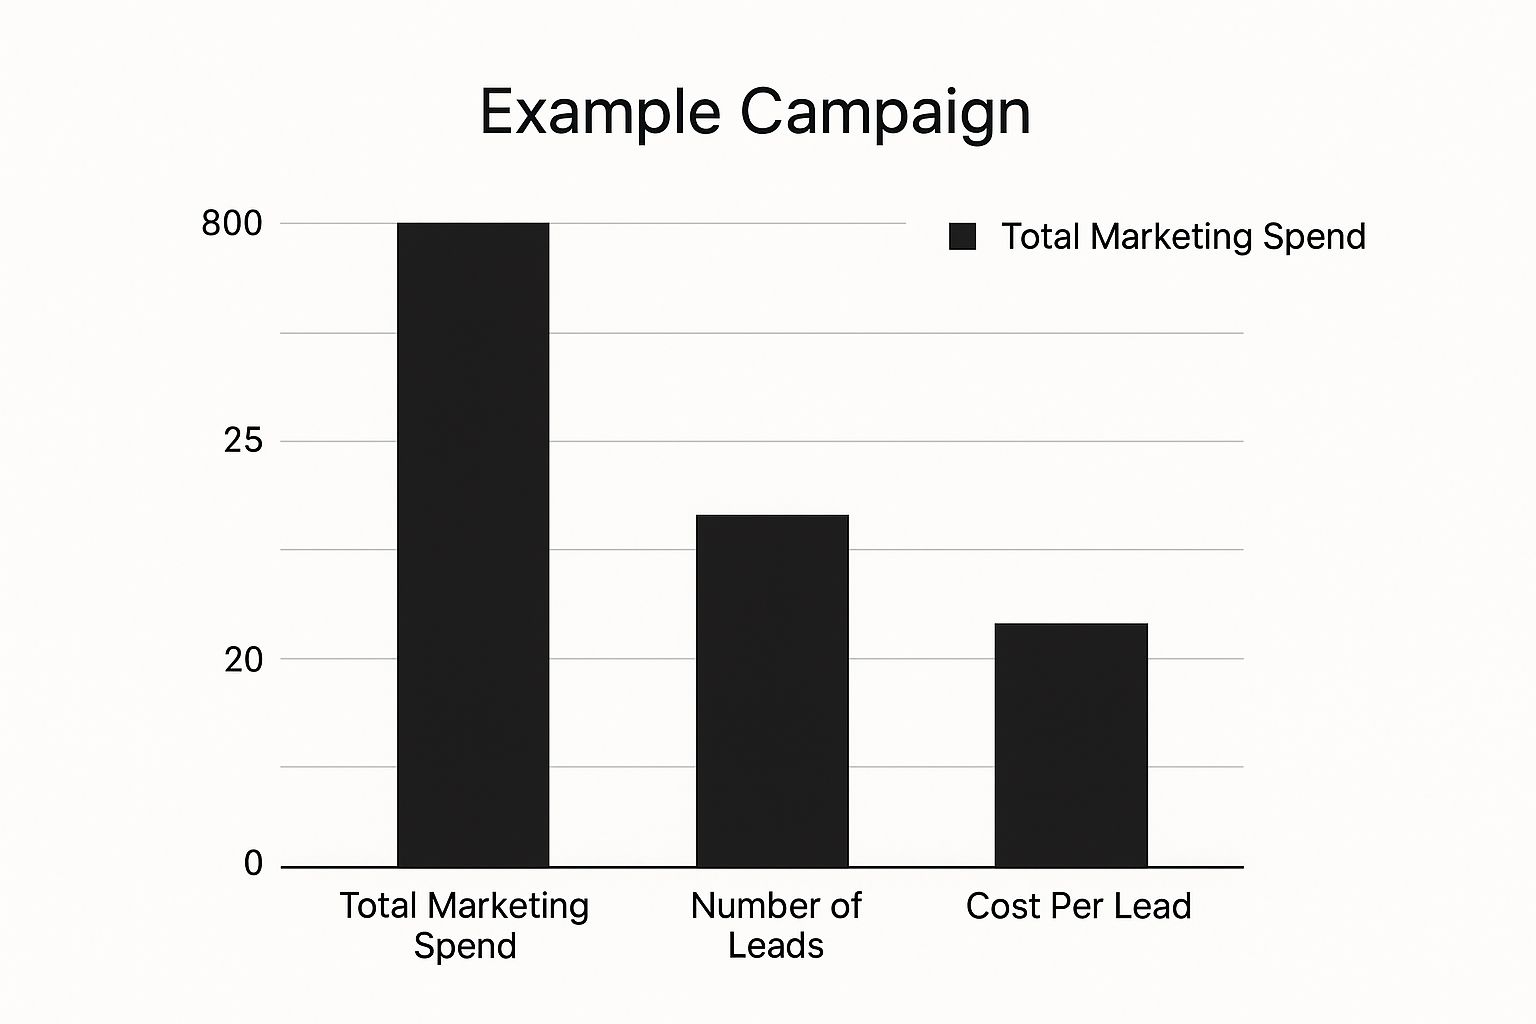
It’s pretty clear here: divide the $5,000 total spend by 100 leads, and you land at a clean $50 CPL. Now for the fun part—applying this to the real world.
Sample CPL Scenarios: B2B vs. B2C
To really illustrate how much CPL can vary, let's compare two totally different marketing campaigns. One is a high-volume, low-cost B2C play, and the other is a high-stakes B2B effort. Notice how the definition of a "lead" and the acceptable costs are worlds apart.
| Metric | B2B SaaS Campaign (LinkedIn) | B2C E-commerce Campaign (Instagram) |
|---|---|---|
| Total Marketing Spend | $9,350 | $1,850 |
| Channels Used | LinkedIn Ads, Google Ads, Content | Instagram Ads |
| What Counts as a Lead? | Whitepaper download + webinar registration | "Get a Quote" form submission |
| Total Leads Generated | 45 Marketing Qualified Leads (MQLs) | 74 quote requests |
| Final Calculated CPL | $207.78 | $25.00 |
You can see right away that a $207.78 CPL might seem terrifying to the e-commerce brand, while the SaaS company would likely be thrilled with that number. Context is everything.
Scenario 1: B2C E-commerce on Instagram
Imagine a direct-to-consumer brand that sells custom pet portraits. They launch an Instagram campaign to get people interested in their $150 product. For them, a "lead" is anyone who fills out their "Get a Quote" form.
Here’s a quick breakdown of their monthly campaign costs:
- Instagram Ad Spend: $1,500
- Freelance Designer (for ad creative): $300
- Social Media Scheduling Tool: $50
Their total marketing spend for this push is $1,850. At the end of the month, their efforts brought in 74 quote requests.
The math is straightforward: $1,850 / 74 leads = $25 CPL.
For a product that sells for $150, a $25 CPL is fantastic. It leaves a ton of room for profit and signals that this campaign is a winner worth scaling up.
Scenario 2: B2B Software Multi-Channel Campaign
Now, let's pivot to a much more complex B2B world. A SaaS company is trying to generate Marketing Qualified Leads (MQLs) for its $10,000 annual subscription. Their definition of a lead is much stricter: someone has to download their industry whitepaper and register for an upcoming product webinar.
This campaign is bigger, with more moving parts and higher costs:
- LinkedIn Ad Spend: $5,000
- Google Ads Spend: $3,000
- Content Writer (for whitepaper): $1,000
- Webinar Platform Fee: $150
- Marketing Automation Software (pro-rated): $200
The total marketing spend here balloons to $9,350. This significant investment results in 45 highly qualified MQLs.
Plugging this into the formula: $9,350 / 45 leads = $207.78 CPL.
A CPL over $200 might make you flinch at first, but for a B2B company with a high-ticket product, it's likely a home run. If just one or two of these high-intent leads convert to a sale, the return on investment will be massive.
The key takeaway is that a "good" CPL is entirely relative. What's disastrous for a low-cost e-commerce brand can be incredibly profitable for a high-value B2B service.
Industry-wide analysis backs this up, showing just how much CPL can swing. For instance, some B2B companies running LinkedIn campaigns see average CPLs around £100, while retail brands on Google Ads can get CPLs as low as £10. You can find more great insights into industry CPL benchmarks from First Page Sage. Always remember, context is king when you're evaluating performance.
Automating CPL Tracking with LeadSavvy Pro
Let's be honest, nobody enjoys wrestling with spreadsheets to figure out their CPL. It’s slow, tedious, and a surefire way to make mistakes, especially as your marketing campaigns grow. This is where automation completely changes the game. It’s the difference between being a reactive data clerk and a proactive, strategic marketer.
Instead of wasting hours downloading CSV files and trying to match up numbers, a platform like LeadSavvy Pro does all the heavy lifting for you. Its real power is in automatically pulling your spending data from all your ad platforms and syncing with your CRM to count new leads in real-time. This gives you one single, reliable place to see what’s actually happening.
Centralize Your Marketing Metrics
One of the biggest wins with automation is getting a central dashboard for all your performance data. Imagine seeing your ad spend from Google, Meta, and LinkedIn right next to the number of leads generated—all updated instantly. No more tab-switching chaos.
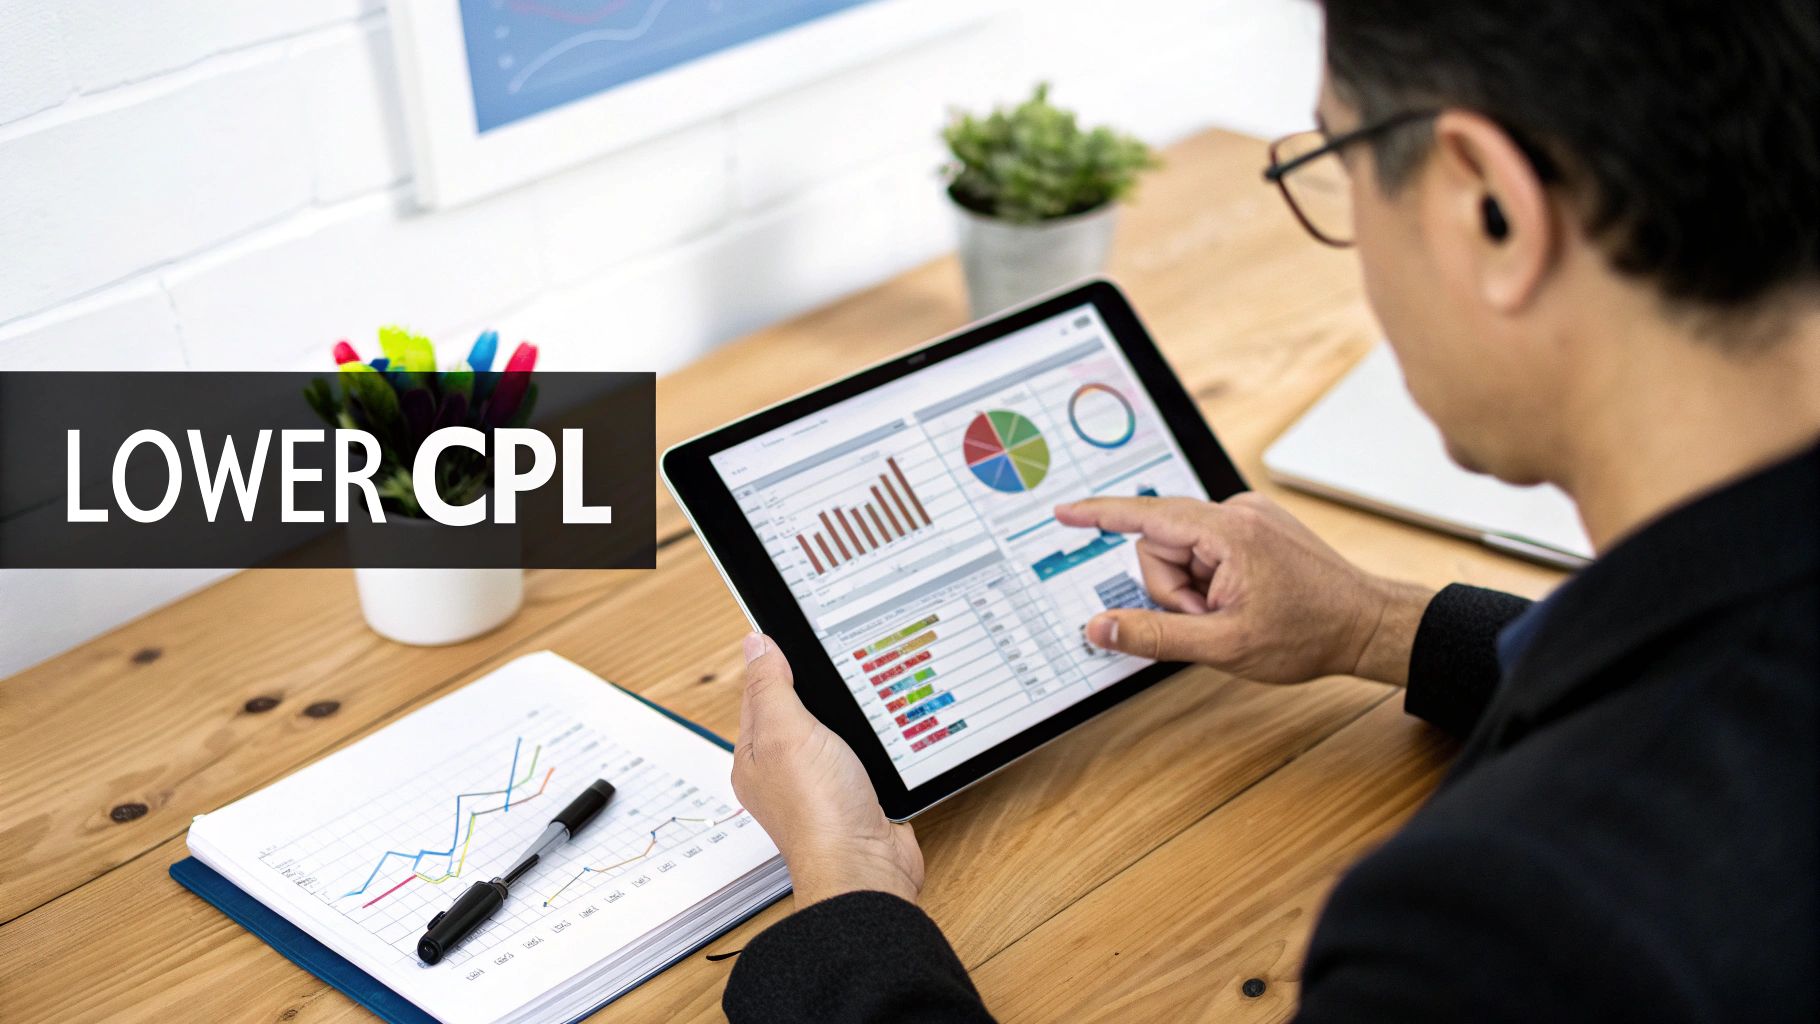
The screenshot above shows a LeadSavvy Pro dashboard where you can see campaign performance at a glance. It clearly lays out key metrics like spend and leads, making it incredibly easy to spot which channels are crushing it without digging through five different platforms. That kind of immediate visibility is what lets you make smart decisions, fast.
This unified view breaks down data silos and makes sure everyone on your team is working from the same accurate numbers. It turns a messy, confusing process into a clear, actionable overview of your marketing engine.
By automating the flow of data, you're not just saving time; you're building a reliable foundation for analysis. This allows you to trust your numbers and focus on what truly matters—optimizing your campaigns for a lower cost per lead.
Set Up Automated Reports and Insights
Beyond just a live dashboard, automation tools are brilliant at delivering insights directly to you. With LeadSavvy Pro, you can set up automated reports that keep an eye on your CPL trends over time. You’ll get notified about any big changes, so you can jump on a sudden spike or double down on a winning trend.
For instance, the platform’s insights might highlight that your Facebook campaigns are bringing in leads at half the cost of your LinkedIn ads. For marketers juggling multiple social campaigns, learning how to automate Facebook leads can be a massive game-changer for your budget and your time. You can find more on that here: https://leadsavvy.pro/post/automate-facebook-leads/
This is the kind of specific, channel-level data that drives smart budget decisions.
To really dial in your CPL tracking, you need to think about how your system connects with your CRM. Strong HubSpot integrations, for example, are essential for ensuring lead data flows seamlessly from the moment of capture to the final calculation. This holistic approach guarantees every cost and every lead is accounted for automatically, giving you a crystal-clear picture of your performance.
This is how you turn CPL from a simple metric into a powerful tool for growth.
Figuring out your CPL is the first step. The real payoff comes when you use that number to make smarter, more profitable decisions about where to put your marketing dollars.
A raw CPL number is just data; what you do with it is what sparks real growth.
Think of your CPL as a flashlight. If one channel has a sky-high CPL while another is humming along efficiently, it’s a bright, flashing sign telling you where to look closer. This isn't just about comparing big channels, either. You need to drill down into specific campaigns, ad groups, and even individual ads to find what's working and what's just burning cash.
How to Turn CPL Data Into Action
Start with a simple side-by-side comparison. Lay out the CPL for each of your marketing channels.
You might see that your Google Ads are bringing in leads for $50 a pop, but your LinkedIn campaigns are costing a hefty $250 per lead. The gut reaction? Yank the budget from LinkedIn and dump it all into Google.
But hold on. Before you make any sudden moves, you have to look deeper. Are the leads from LinkedIn higher quality? Do they close at a better rate or spend more money with you over time? This is where you have to connect CPL to a much more important metric: Customer Lifetime Value (CLV).
A higher CPL is perfectly fine—if it leads to a much higher CLV. The goal isn’t just to get cheap leads; it's to acquire profitable customers. Nailing that balance is the key to scaling your business.
When to Shift Your Marketing Budget
Once you have that full picture—cost vs. value—you can make choices with confidence. If that high-CPL channel isn't pulling its weight with high-value customers, it’s time to make a change.
Here’s a simple framework for making these decisions:
- Spot the Underperformers: Flag any campaigns where the CPL is just too high compared to the revenue that lead eventually brings in.
- Try to Fix It First: Don't just kill a channel right away. Before you pull the plug, see if you can lower its CPL. Can you test new ad creative? Refine your audience targeting? A better landing page, maybe?
- Reallocate with a Plan: If optimization doesn't work, start shifting your budget. Move a slice of it from the expensive, low-performing channel over to your proven winner. Then, watch the results like a hawk to make sure lead quality and volume hold up.
This cycle of constant analysis and reallocation is what separates the pros from the amateurs. Understanding how to use these numbers is the fastest way to improve your marketing ROI and make sure every dollar you spend is pulling its weight.
When you turn data into action, you move from just calculating CPL to truly mastering it.
Cost Per Lead FAQ: Your Top Questions Answered
Once you start digging into cost per lead, a few key questions always pop up. Let's get them out of the way so you can track your CPL with total confidence.
Think of this as your quick-reference guide for the CPL essentials.
What’s a Good Cost Per Lead, Really?
Honestly, there’s no magic number. A "good" CPL is whatever allows you to turn a healthy profit.
For an e-commerce store selling $50 t-shirts, a $100 CPL would be a total nightmare. But for a B2B software company selling a $15,000 annual license, a $400 CPL is a steal. It all comes down to your industry, your margins, and most importantly, your customer lifetime value (CLV).
What’s the Difference Between CPL and CPA?
This one trips people up all the time, but the distinction is crucial. They measure two totally different moments in your customer's journey.
- Cost Per Lead (CPL): This is what you pay to get a potential customer to raise their hand. It's the cost of acquiring a contact who's shown interest, like filling out a form.
- Cost Per Acquisition (CPA): This is what you pay to get a paying customer. It’s the total cost to turn that interested lead into an actual sale.
Bottom line: CPL is about opening the conversation. CPA is about closing the deal. You need both to see if your marketing funnel is actually working from top to bottom.
Ready to stop guessing and start tracking your CPL with precision? LeadSavvy Pro automates the entire process, syncing your ad spend and leads in real-time. Get started for free today!


