Master Lead Generation Performance Metrics to Boost Your Results
Think of lead generation metrics as your business's dashboard. They're the real, hard numbers—like your Cost Per Lead or Conversion Rate—that tell you if your marketing is actually making you money or just burning through your budget.
Why Lead Generation Metrics Are Your Business Dashboard
Seriously, imagine driving your car without a speedometer, a fuel gauge, or any warning lights. You'd have no idea how fast you were going, when you'd run out of gas, or if the engine was about to blow. That’s exactly what it’s like to run a marketing campaign without tracking lead generation performance metrics. You're just guessing, hoping for the best, with zero control over where you end up.
These numbers are what separate professional marketing from a hobby. They give you the concrete proof you need to stop relying on hunches and start making smart decisions that actually grow your revenue. It's an old saying but it's true: what gets measured gets managed.
From Guesswork to Growth
Without metrics, you're flying completely blind. You might see a huge spike in website traffic and pat yourself on the back, only to find out later that none of those visitors are actually turning into leads. Or worse, you might kill a social media campaign that seems a bit slow, not realizing it's quietly bringing in your most profitable customers.
When you track the right numbers, you can:
- Spot the Real Problems: Getting tons of leads but booking very few demos? That tells you you have a lead quality problem, not a lead volume problem.
- Double Down on What Works: Find out which channels are delivering the best leads and pour more fuel on that fire.
- Justify Your Spend: Stop having awkward conversations about the marketing budget and start showing exactly how every dollar is turning into a return.
Key Lead Generation Metrics at a Glance
To give you a roadmap for what’s ahead, we've put together a quick look at the core metrics every business needs to track. Think of this as your cheat sheet. Each one of these numbers tells a crucial part of your customer acquisition story, from the first click to the final sale.
Here's a breakdown of the metrics we'll be diving into.
| Metric | What It Measures | Why It Matters |
|---|---|---|
| Cost Per Lead (CPL) | The average cost to acquire one new lead. | Shows you if your campaigns are efficient or just expensive. |
| Conversion Rate | The percentage of people who take a desired action. | Tells you how good you are at turning casual interest into real engagement. |
| Lead Quality Score | A score that shows how ready a lead is to buy. | Helps your sales team focus on the hottest leads first. |
| Time to Contact | How long it takes to follow up with a new lead. | Speed is everything—this metric tracks how fast you respond. |
Understanding these metrics is the first step. The real magic happens when you start using them together to see the full picture of your marketing performance. Ready to dive in? Let's get started with the first one.
Measuring Awareness with Top-of-Funnel Metrics

Every customer relationship begins with a single moment of awareness. This is your top-of-funnel, the very first touchpoint where you turn complete strangers into potential customers. The lead generation performance metrics you track here are your early warning system, telling you if your message is actually landing and if your campaigns are casting a wide enough net.
Think of it like fishing. You need to know how many lines you have in the water (Lead Volume), what kind of fish you're attracting (Marketing Qualified Leads), and how much it costs to bait each hook (Cost Per Lead). These three metrics are the bedrock of your top-of-funnel strategy, giving you a brutally honest look at how well your outreach is performing.
Lead Volume: Your Starting Point
Lead Volume is as straightforward as it gets. It’s the raw count of new leads your marketing brings in over a set period. While it might seem basic, this number is a vital pulse check on your entire operation. A sudden nosedive in lead volume is often the first sign that an ad campaign has fizzled out or a key landing page is broken.
But be careful—volume by itself can be a vanity metric. Piling up a huge number of leads who have zero intention of buying is just busy work. That’s why you have to look at lead volume in the context of quality and cost.
Marketing Qualified Leads: The Quality Filter
This is where Marketing Qualified Leads (MQLs) come into play. An MQL isn't just a random contact; they're a prospect who has shown real interest and meets a minimum set of criteria you’ve established. Maybe they downloaded an ebook, signed up for your webinar, or kept coming back to your pricing page.
Think of MQLs as the leads who are raising their hands and saying, "Hey, I'm listening." Tracking them separately from your total lead volume is critical. It shows you if your targeting is precise or if you're just yelling into the void.
A high lead volume paired with a low MQL rate is a classic red flag. It usually means your marketing message is too broad, attracting a crowd of people who will never become customers. Your job isn't just to get leads; it's to get the right leads.
Cost Per Lead: The Efficiency Gauge
Finally, there’s Cost Per Lead (CPL). This metric cuts straight to the chase and answers one simple question: how much are you spending to get one new lead? Getting a grip on your CPL is absolutely essential for allocating your budget smartly and not just throwing money away.
Calculating your CPL is easy:
Total Campaign Spend / Total New Leads = Cost Per Lead (CPL)
For example, if you spend $2,000 on a LinkedIn campaign that brings in 100 leads, your CPL is $20. If you spend that same $2,000 on an SEO effort that generates 50 leads, your CPL is $40. Right away, you can see LinkedIn is the more cost-effective channel for drumming up initial interest in this case.
Lead generation is a massive priority for most businesses, and the data proves it. On average, organizations generate about 1,877 leads per month, with around 81% of those becoming MQLs. The average CPL across all industries sits at $198.44, a number that should tell you just how important it is to keep your spending in check. You can explore more lead generation stats to see how your numbers stack up.
For any business serious about growth, understanding these foundational figures is non-negotiable. By focusing on these initial lead generation KPIs, you build a rock-solid foundation for your entire marketing and sales engine.
Alright, let's get into the nitty-gritty. Once a prospect moves past that initial "just browsing" phase, they land right in the middle of your funnel. This is where things get serious.
We're no longer just counting clicks and impressions. The lead generation performance metrics that matter here are all about intent, quality, and how efficiently your own teams are operating.
Think of this stage as a series of make-or-break checkpoints. These people aren't just names on a list anymore; they're actively trying to figure out if you're the right solution for them. Your job is to measure how engaged they are and, just as importantly, how well your marketing and sales teams are working together to keep that flame alive.
What's a Lead Quality Score, Really?
Let’s be honest: not all leads are created equal. Some are just kicking the tires, while others are practically begging to give you their money. A Lead Quality Score is your secret weapon for telling them apart. It's basically a system that automatically assigns points to leads based on who they are and what they do.
This score helps your sales team stop guessing and start focusing their energy where it actually counts—on the leads showing the strongest buying signals. You can build a simple scoring model by giving points for specific actions.
For instance, you could set up a framework like this:
- +5 points: They visit your site and are from one of your target industries.
- +10 points: They download a meaty case study or whitepaper.
- +15 points: They actually show up for a live product demo.
- +25 points: They keep coming back to your pricing page. (That's a big one!)
- -10 points: They're a student or from a country you don't serve.
A lead hitting 50 points or more? That's a "hot" lead. Get them on the phone, stat. A lead with just 15 points? They probably need a bit more nurturing before they're ready for a sales call. This simple, data-driven approach ensures you're talking to the right people at the right time.
The MQL-to-SQL Rate: Your Team's Health Check
If you track only one thing to gauge the alignment between marketing and sales, make it the Marketing Qualified Lead (MQL) to Sales Qualified Lead (SQL) Conversion Rate. This number shows you what percentage of leads your marketing team thinks are good (MQLs) are actually accepted by the sales team as worth pursuing (SQLs).
Here’s the simple formula:
(Total SQLs / Total MQLs) x 100 = MQL-to-SQL Conversion Rate
A low MQL-to-SQL rate is a massive red flag. It’s a dead giveaway that marketing and sales are speaking different languages. Marketing might be tossing leads over the fence that sales considers total junk, which wastes everyone's time and builds resentment between the teams.
If this number is tanking, it's time to call a meeting. Get both teams in a room and hash out what a "qualified lead" actually means. Agreeing on specifics like company size, industry, and behavioral signals (like demo requests) is the first, most crucial step to fixing this metric.
Why Your Lead Response Time Is Everything
In the world of sales, speed isn't just a nice-to-have—it's everything. Lead Response Time tracks how long it takes for someone on your team to follow up with a new lead after they've reached out. The data here is crystal clear: the faster you are, the more likely you are to win the deal.
A lead’s initial excitement fades fast. In fact, waiting even 30 minutes to respond can slash your odds of ever making contact. Wait a full day? You might as well have thrown that lead in the trash.
This is where a bit of automation can completely change the game. A tool like LeadSavvy Pro can instantly fire new Facebook leads straight into a Google Sheet or your CRM, triggering immediate alerts for your sales team. This closes the gap between when a lead shows interest and when you follow up, cutting out the manual delays that kill deals.
When you nail your Lead Response Time, you’re not just being more efficient; you're directly boosting your revenue. Keeping a close eye on these middle-funnel lead generation performance metrics—Lead Quality Score, MQL-to-SQL Rate, and Response Time—is what separates the businesses that just get leads from the ones that consistently close them.
Alright, let's get these metrics dialed in. This is where the rubber meets the road.
Proving Your Worth with Bottom-of-Funnel Metrics
This is the final checkpoint. You’ve done the hard work of attracting prospects and keeping them engaged. Now, we’re at the bottom of the funnel, where your marketing efforts finally turn into cold, hard revenue.
The lead generation performance metrics we're about to cover are the ones that get the C-suite to sit up and listen. Why? Because they speak the language of business growth and profitability.
These are the numbers that prove your value and justify every dollar in your budget. We're moving past simple activity metrics and focusing on the three heavy hitters that tie marketing directly to the bottom line: Lead-to-Customer Conversion Rate, Customer Acquisition Cost (CAC), and Customer Lifetime Value (CLV).
Get these right, and you'll have no problem demonstrating marketing's true ROI.
This chart shows the cost per lead across a few common channels, giving you a quick look at where initial costs might be lowest.
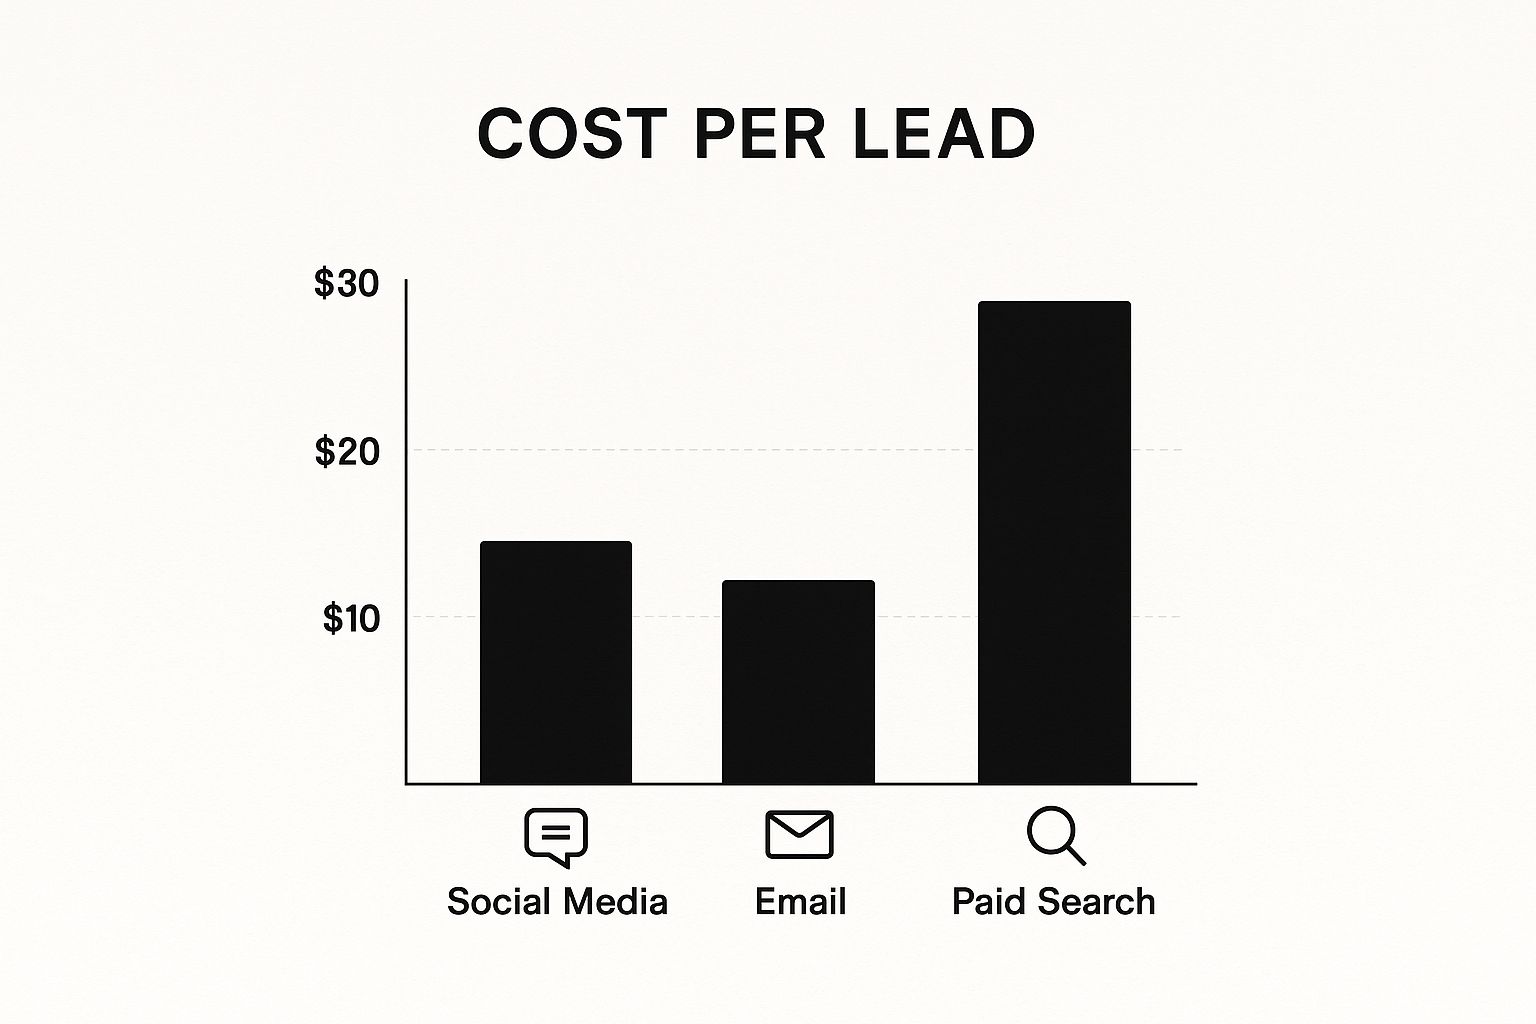
As you can see, email looks like a bargain for generating a lead. But as we're about to find out, the cheapest lead isn't always the most profitable one in the long run.
Lead-to-Customer Conversion Rate
This is it—the ultimate measure of marketing and sales success. Your Lead-to-Customer Conversion Rate tells you exactly what percentage of your leads end up becoming paying customers.
While the metrics we looked at earlier measure interest, this one measures results. It's a direct reflection of two critical things: your ability to attract the right people and how effectively your sales team can close the deal.
The formula is simple but incredibly powerful:
(Number of New Customers / Total Number of Leads) x 100 = Lead-to-Customer Rate
Let’s say your marketing efforts pulled in 500 leads last quarter, and the sales team closed 25 of them. Your lead-to-customer rate is 5%. This single number gives you a clear benchmark for the overall health of your entire customer acquisition machine.
Customer Acquisition Cost (CAC)
Cost Per Lead (CPL) is great for checking the efficiency of a single campaign, but Customer Acquisition Cost (CAC) tells the whole story. CAC calculates the total cost to land one paying customer, giving you a much more complete picture of your spending.
The key difference here is that CAC rolls in all marketing and sales expenses—not just your ad spend. We’re talking salaries, software subscriptions (like your CRM or a tool like LeadSavvy Pro), and any other overhead needed to get a deal across the finish line.
To figure it out, just add up all your relevant costs over a specific period and divide that by the number of new customers you brought in during that same time.
(Total Marketing & Sales Costs / New Customers Acquired) = CAC
For instance, if your total marketing and sales expenses for the month hit $10,000 and you acquired 25 new customers, your CAC is $400.
It’s easy to get tunnel vision on CPL, but a high lead-to-customer rate from a more expensive channel might actually result in a lower CAC. This is why you can't look at any single metric in a vacuum. To learn more about how these numbers work together, you can get more details on lead generation KPIs.
While CPL helps you understand campaign-level costs, CAC is what tells you if your overall strategy is sustainable. Let's break down the difference a bit more.
CPL vs. CAC: Understanding the Difference
A lot of marketers use CPL and CAC interchangeably, but they measure two very different things. CPL is about efficiency at the top of the funnel, while CAC is about profitability at the bottom. Here’s a quick comparison to clear things up:
| Aspect | Cost Per Lead (CPL) | Customer Acquisition Cost (CAC) |
|---|---|---|
| What It Measures | The cost to generate a single potential customer (a lead). | The total cost to acquire a single paying customer. |
| Scope | Typically focused on a specific marketing campaign or channel. | A holistic metric including all marketing and sales expenses. |
| Costs Included | Ad spend, content creation costs for a specific campaign. | All marketing/sales salaries, software, ad spend, overhead. |
| Business Question | "How efficiently are we generating interest?" | "How much does it cost us to actually win a new customer?" |
| Example | A $500 ad campaign that generates 50 leads has a CPL of $10. | $10,000 in total costs that result in 25 customers gives a CAC of $400. |
In short, CPL helps you optimize your lead generation tactics, while CAC tells you if your business model is actually working. You need both to get the full picture.
Customer Lifetime Value (CLV)
If you have a North Star metric for sustainable growth, this is it. Customer Lifetime Value (CLV) predicts the total revenue you can expect to earn from a single customer over the entire course of your relationship.
Understanding your CLV is a complete game-changer. It tells you exactly how much you can afford to spend to acquire a customer and still be profitable.
Think about it: if your average CLV is $5,000 and your CAC is $400, you've got a fantastic, healthy business. But if your CLV is only $500 and your CAC is $400, you’re operating on razor-thin margins and are one bad month away from trouble.
Calculating a precise CLV can get pretty complex, but a simple version looks like this:
(Average Purchase Value x Average Purchase Frequency) x Average Customer Lifespan
The real magic of CLV happens when you use it to guide your strategy. By figuring out which customer segments have the highest CLV, you can aim your marketing firepower at attracting more of those "ideal" customers. This lets you confidently spend more to acquire high-value clients, knowing the long-term payoff will be well worth it.
Turning Metrics into Marketing Improvements
Tracking your lead generation performance metrics is great, but it's only half the battle. Think of the numbers on your dashboard like a doctor's chart—they tell you what’s wrong, but they don't hand you the prescription. The real magic happens when you turn those data points into decisive action.
This is where you graduate from being a scorekeeper to a true strategist. It’s the difference between shrugging and saying, "Well, our CPL is high," versus knowing exactly which levers to pull to bring it back down. Your data becomes an active playbook for growth, not just a passive report card.
Diagnosing and Fixing Common Problems
When a key metric starts flashing red, don’t panic. It's time to play detective. Every metric tells a story, and the best marketers know how to read between the lines. The trick is to have a simple, repeatable process for troubleshooting whatever your data throws at you.
Think of it as a checklist for your marketing engine. Is a metric looking grim? Let's walk through how to figure out why and, more importantly, how to fix it.
Problem 1: High Cost Per Lead (CPL)
A high CPL from a specific channel is a clear sign you're overpaying for attention. Before you hit the panic button and kill the campaign, run through this quick diagnostic.
- Ad Creative: Is your ad copy boring? Is the image failing to grab attention? A/B test your headlines, visuals, and calls-to-action to see what actually resonates with people.
- Audience Targeting: Are you showing your ads to the right crowd? If you're targeting people who have zero interest in your offer, your CPL will naturally skyrocket. Get granular and refine your audience segments.
- Landing Page Experience: Is your landing page slow, confusing, or just plain clunky? A bad user experience will kill your conversion rates and drive up your CPL. Make sure the page loads fast, the form is dead simple, and the value is obvious.
Problem 2: Low MQL-to-SQL Conversion Rate
This is the classic symptom of a disconnect between your marketing and sales teams. If marketing keeps lobbing leads over the fence that sales immediately rejects, you’re burning budget, time, and team morale.
This isn't just a data problem; it's a people problem. A low MQL-to-SQL rate is the metric that screams your teams are not on the same page about what makes a "good lead."
The fix? Get both teams in the same room (virtual or otherwise). Host a workshop to hammer out and agree on your lead qualification criteria. Define the exact attributes (like company size) and behaviors (like requesting a demo) that officially make a lead "sales-ready." Getting this alignment right is the foundation of an efficient revenue machine.
Building Your Optimization Cadence
One-off fixes are good, but building a culture of continuous improvement is way better. To make data-driven decisions a real habit, you need a system—a regular rhythm for reviewing your numbers and making smart adjustments.
Start by setting up a simple metrics dashboard. It doesn't need to be fancy. A tool like LeadSavvy Pro can centralize all your lead data automatically, but even a basic spreadsheet can work to track your KPIs week over week.
Once your dashboard is live, schedule these regular review meetings:
- Weekly Check-in: A quick, 15-minute look at top-of-funnel metrics like Lead Volume and CPL. This is for making small, tactical tweaks to your live campaigns.
- Monthly Strategy Review: A deeper dive into the entire funnel, including MQL-to-SQL rates and CAC. This is where you zoom out and make bigger strategic calls.
- Quarterly Business Impact Meeting: This is where you connect your marketing efforts to the bottom line. Present your CAC, CLV, and ROI to leadership to show the financial value you're driving.
This structured approach turns your lead generation from a series of disconnected campaigns into a smart, learning system. By consistently analyzing your lead generation performance metrics and taking targeted action, you can dramatically improve marketing ROI and build a predictable pipeline for growth.
How Customer Retention Fuels Smarter Lead Generation
Most people think lead generation ends the moment a prospect signs on the dotted line. But what if I told you that’s where the real work begins? Your happiest, most loyal customers are secretly your most powerful engine for future growth.
When you shift your focus from just acquiring new customers to keeping the ones you have, something clicks. You unlock a more sustainable, profitable, and frankly, smarter way to run your marketing. This is where your lead generation performance metrics suddenly connect directly to customer success. A business that's a pro at keeping customers has a massive advantage—it gives them the cash and confidence to invest more at the top of the funnel, attracting the right kind of leads from the very start.
The Power of Keeping Your Customers
When you know which customers stick around the longest and spend the most, you can work backward. You can reverse-engineer your entire marketing strategy to find more people just like them. This is how a metric like Customer Lifetime Value (CLV) goes from being a simple performance number to a strategic weapon for your ad campaigns.
CLV, measured alongside your Customer Acquisition Cost (CAC), tells you the total revenue you can expect from a customer over their entire relationship with you. Here’s a statistic that should stop you in your tracks: increasing customer retention by just 5% can explode profits by 25% to 95%. This isn't just a fun fact; it's proof that focusing on keeping your current customers directly fuels your long-term value. You can dig into more data about the impact of lead generation KPIs on Smarte.pro.
This creates a powerful feedback loop. Once you understand just how valuable a loyal customer is, you can confidently justify spending more to acquire leads who look exactly like them.
Think of it this way: high retention is like earning a bigger marketing budget. It gives you permission to spend more wisely to acquire the best-fit customers, rather than just chasing the cheapest leads.
Refining Your Targeting with Retention Data
Your existing customer base is a goldmine. The characteristics, behaviors, and even the language used by your happiest, highest-CLV customers are the exact blueprint for your Ideal Customer Profile (ICP).
Use this data to sharpen your entire strategy:
-
Sharpen Ad Targeting: Stop guessing. Build lookalike audiences on platforms like Facebook based on your most valuable customer segments.
-
Refine Your Messaging: Listen to your customers. Pull words and pain points directly from their feedback and reviews to use in your ad copy and on your landing pages.
-
Inform Content Creation: Create content that actually solves problems. Write blog posts and case studies that address the specific challenges your best customers had before they found you.
When you start focusing on what works for your existing customers, you naturally start attracting prospects who are already wired to love what you do. This makes your entire funnel more efficient. Your lead qualification efforts become far more successful because you started with better raw material in the first place.
It's a complete shift—from a numbers game to a strategic hunt for quality.
Of course. Here is the rewritten section, designed to sound like an experienced human expert and match the provided examples.
Your Top Lead Metric Questions, Answered
Even after you've got a handle on the key metrics, a few questions always seem to pop up. Let's tackle some of the most common ones we hear from marketers who are trying to get their lead generation tracking just right.
How Often Should I Be Checking My Lead Metrics?
There's no single magic number here. The right rhythm really depends on the metric itself and how long your sales cycle is. Think of it like this: match how often you look at the data to how quickly that data changes.
A good starting point:
- Daily or Weekly: Keep a close eye on your top-of-funnel numbers like Lead Volume and Cost Per Lead (CPL). This is especially true when you're running active campaigns, as it lets you make quick, smart adjustments on the fly.
- Weekly or Bi-Weekly: This is the perfect time to review your mid-funnel metrics, like your MQL-to-SQL rate. Checking in at this frequency helps you spot developing trends in your lead quality or see if your sales and marketing teams are starting to drift apart.
- Monthly or Quarterly: Zoom out to look at the big picture. This is where you analyze strategic metrics like Customer Acquisition Cost (CAC) and Customer Lifetime Value (CLV) to make smarter decisions about your overall budget and long-term strategy.
What’s a Good Cost Per Lead?
Ah, the million-dollar question. The honest answer? It depends.
There's no universal benchmark for a "good" CPL. It changes wildly based on your industry, the channel you're using, and who you're trying to reach. A $20 CPL might be a huge win for an e-commerce brand, but it would be a total disaster for a B2B SaaS company that sells expensive software.
Instead of chasing some random industry average for CPL, shift your focus. Look at how your CPL relates to your Customer Lifetime Value (CLV). A healthy CPL is any price that lets you bring in new customers profitably over the long run. That's the only benchmark that truly matters.
I'm Getting Lots of Leads, but Almost None of Them Are Converting. What Do I Do?
This is a classic problem, and it almost always points to one of two things: a breakdown in lead quality or a disconnect with your sales team.
Getting a high volume of leads means your marketing is definitely getting attention—that's the good news. But the low conversion rate suggests you're attracting the wrong kind of attention.
First, dig into your MQL-to-SQL conversion rate. If that number is low, it’s a flashing red light that your marketing and sales teams don't agree on what a "good lead" actually is. The best fix is to get both teams in a room (virtual or otherwise) and hammer out a crystal-clear, shared definition.
You should also take a hard look at where all those leads are coming from. You might find you need to tweak your ad targeting or content to attract prospects who are a much better fit for your ideal customer profile.
Ready to stop wasting time on manual downloads and start acting on leads instantly? LeadSavvy Pro automates the entire process, sending your Facebook leads directly to where you need them. Try LeadSavvy Pro for free and see how fast you can turn new leads into real customers.