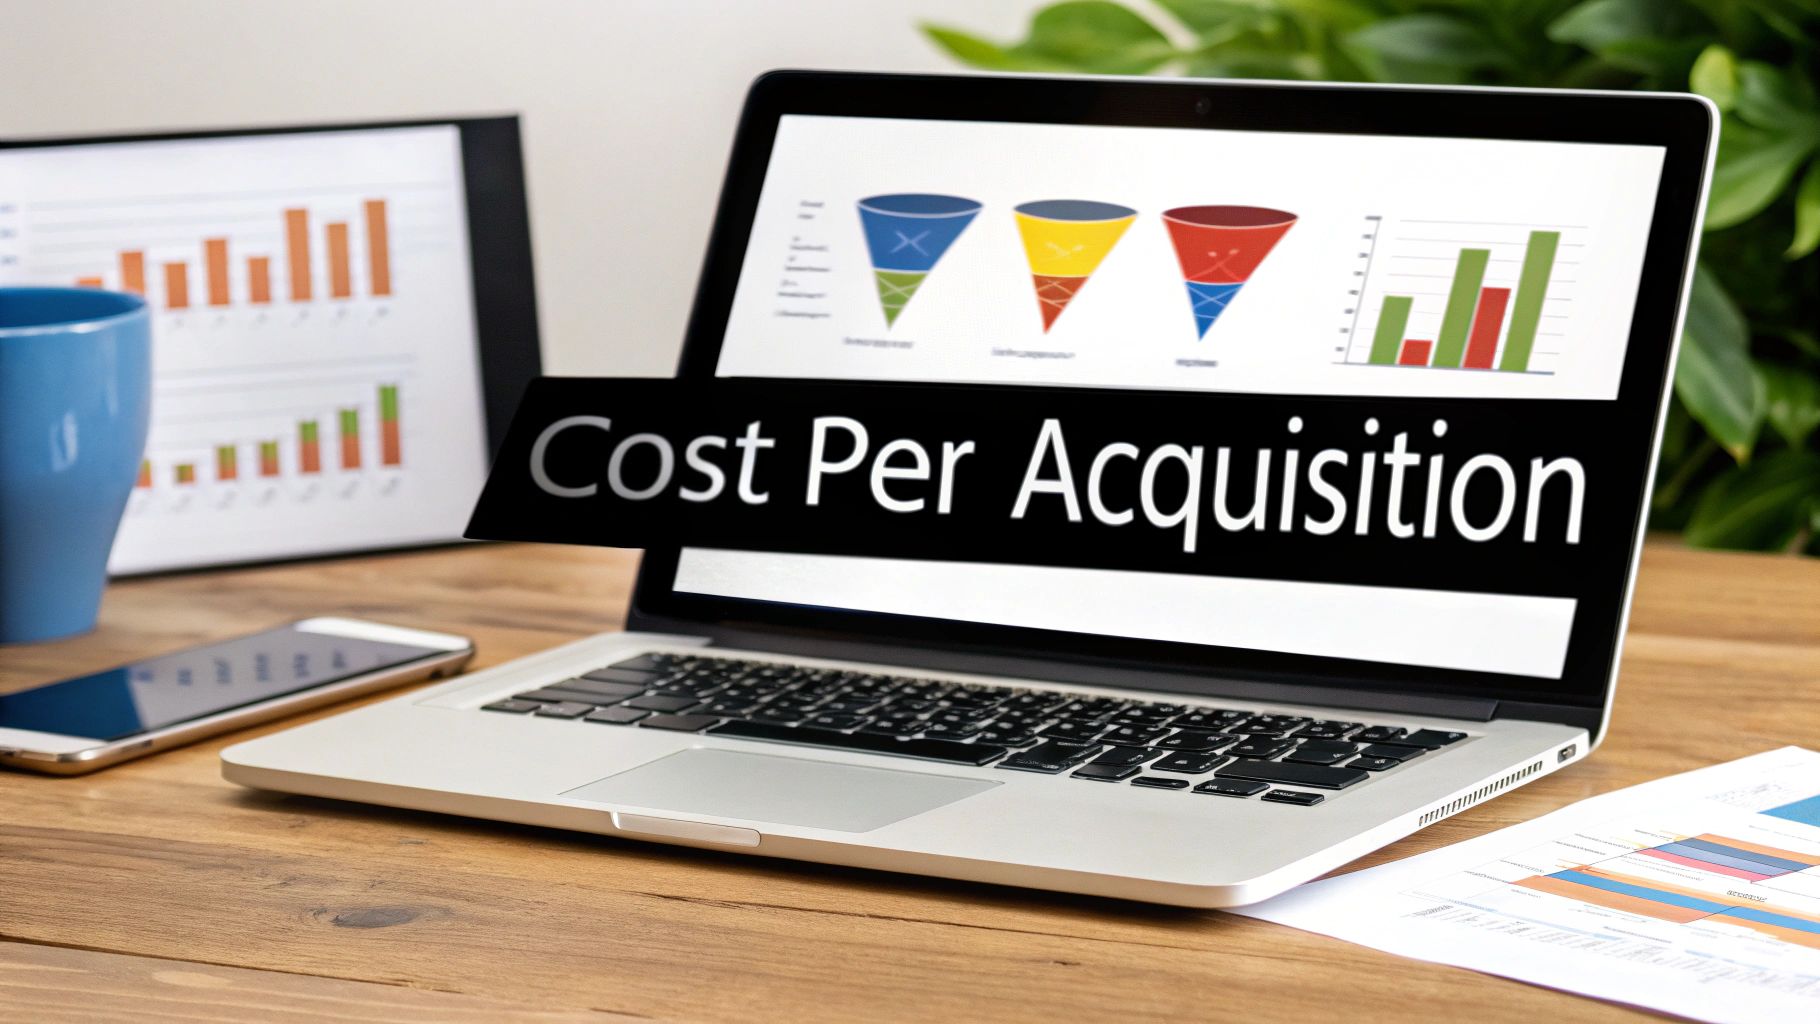
What Is Cost Per Acquisition And Why It Matters For Marketing
Cost Per Acquisition (CPA) measures exactly how much you’re spending to win each new customer. This single metric shines a spotlight on which marketing channels are pulling their weight—and which ones need a tune-up.
Understanding What Is Cost Per Acquisition
At its simplest, CPA is your total marketing + sales investment divided by the number of customers acquired in the same timeframe. Breaking it down like this gives you a clear lens on where to pour—or pause—your budget.
- Total Spend covers ad creative, platform fees, analytics tools, and any tech costs.
- Acquisitions count each brand-new customer you secured.
- CPA becomes your universal ROI yardstick, letting you compare apples to apples across campaigns.

CPA = Total Spend / Number of Acquisitions
For instance, if you invest $1.2 million in marketing and sales over a quarter and bring in 3,000 new customers, your CPA sits at $400 per acquisition. That figure quickly tells you which channels deserve more fuel and which ones you might want to rethink. For a deeper dive, explore this cost per acquisition analysis.
Grocery Checkout Analogy
Picture your marketing channels as supermarket checkout lanes. The express lane—say, paid search—moves at breakneck speed but at a premium cost. Meanwhile, the slower registers—organic social or email—are gentler on your budget but can’t process the same volume in a hurry.
These differences in pace and price help explain why your CPA can swing widely from channel to channel.
Before we go further, let’s visualize the CPA formula components in a quick summary.
Quick CPA Overview Table
The table below breaks down each element of the CPA calculation along with a simple numeric example.
| Component | Description | Example Value |
|---|---|---|
| Total Spend | Combined marketing, creative, and tech costs | $1,200,000 |
| Acquisitions | Number of new customers acquired | 3,000 |
| CPA | Cost per customer acquired | $400 |
This mini-snapshot offers a clear starting point—and it sets you up for the detailed, step-by-step guide ahead.
How CPA Guides Budget
Once you have your CPA by channel, you can shift dollars toward the high-performers and trim the rest. Even small reallocations can translate into big efficiency gains.
- Review channel-level CPA each week.
- Establish CPA benchmarks for every campaign.
- Automate budget tweaks when performance thresholds are met.
Tracking CPA trends in near real time helps you nip cost overruns in the bud.
In the sections that follow, we’ll:
- Walk through a detailed CPA calculation.
- Contrast CPA with CPC and CPL.
- Outline methods for precise cost attribution and tracking.
- Share proven tactics to drive your CPA down and ROI up.
Armed with these insights, you’ll master CPA analysis, make smarter budget decisions, and ultimately boost your bottom line. Ready to dive in? Let’s get started!
Calculating Cost Per Acquisition With Examples

When you open your ad dashboard and see a jumble of costs, it’s easy to lose track of what really matters: the cost of winning each customer. That’s where Cost Per Acquisition (CPA) cuts through the noise, turning complex billing into a single, actionable number.
Breaking Down the CPA Formula
At its core, the CPA formula is straightforward:
CPA = Total Spend ÷ Number of Acquisitions
Imagine you invest $10,000 across all your channels and bring in 200 new customers. Plug those figures in:
$10,000 ÷ 200 = $50 CPA
That $50 tells you exactly what each new customer cost you.
To calculate this in practice:
- Gather spend data from every platform—Google Ads, Facebook Ads, email tools, affiliate portals.
- Pull acquisition figures from your CRM.
- Make sure the dates align so each lead or sale matches the spend window.
If your data is messy or attribution windows don’t line up, your CPA will lie. Clean, synchronized numbers are non-negotiable.
CPA Channel Comparison Table
Below is a snapshot of average CPAs across common marketing lanes. Use this as a benchmark to see where you stand.
CPA Channel Comparison Table
| Channel | Average CPA |
|---|---|
| Paid Search | $45 |
| Social Ads | $60 |
| Email Campaigns | $30 |
| Affiliate Partnerships | $75 |
This quick look reveals that Email Campaigns often deliver the lowest CPA, while Affiliate Partnerships tend to carry a premium price tag.
Allocating Spend By Channel
Think of each marketing channel like a checkout lane at the grocery store. Some move fast but cost more per item. Others are slower but can be budget‐friendly if you shop the right deals.
• Paid search: Higher per‐click fees, but traffic is razor‐focused.
• Social Ads: Broader reach; CPAs can swing wildly based on creative and targeting.
• Email Campaigns: Once you build the list, the incremental cost per send is tiny—often yielding bargain‐basement CPAs.
To refine your channel mix:
- Use a 30-day attribution window to capture delayed conversions.
- Weight each touchpoint—first touch, last touch, or something in between.
- Don’t forget offline conversions. Log phone calls and in‐person sales to your CRM.
Handling Multi-Touch Attribution
Buyers rarely convert after a single ad. Most hop between emails, organic search, and paid social before clicking “Buy.” A multi-touch model assigns fractional credit to each step in their journey.
- List every possible touchpoint—ads, organic visits, emails.
- Decide on a weighting scheme: linear, time decay, position-based.
- Compare results against first-touch and last-touch to validate accuracy.
By running these side-by-side, you’ll spot which channels genuinely moved the needle versus those that just said hello.
Benchmarking CPA Trends
CPA doesn’t sit still. It ebbs and flows with seasons, competition, and market shifts. Tracking your CPA month over month reveals patterns you can act on.
Build a simple dashboard with:
- Month (e.g., January)
- Channel CPA
- Variance from Target CPA
Watching that variance line climb or dip tells you when to ramp budgets up or pull back. Over five months, you might see that holiday promos cut CPA in half, while summer slumps push it above target.
By mastering these calculations, dashboards, and attribution models, you transform raw spend data into strategic levers. Next, we’ll dive into proven tactics that actually lower CPA—and show how LeadSavvy Pro can automate the heavy lifting so your numbers stay spotless and your team moves faster.
Comparing CPA With Related Metrics
Cost Per Acquisition (CPA) tells you exactly how much you spend when a prospect becomes a paying customer. It sits deeper in your funnel than Cost Per Click (CPC), Cost Per Lead (CPL), or Cost Per Thousand Impressions (CPM).
Put simply:
- CPC is your ticket into the show.
- CPL reserves your seat before the curtain rises.
- CPA is the popcorn you buy during intermission.
- CPM? Think of renting a billboard that thousands will see.
“Clicks don’t pay the bills. Customers do.” – Anna Lee, Marketing Analyst
That quote drives home the point: high click volume doesn’t equal revenue. You need to follow the money all the way to acquisition.
Understanding Funnel Positions
At the top, CPC captures raw interest.
Mid‐funnel, CPL weeds out casual visitors by collecting form submissions.
At the bottom, CPA measures the real cost of each customer who hands over their card.
| Metric | Funnel Stage | Typical Use Case |
|---|---|---|
| CPC | Awareness | Test ad headlines |
| CPL | Consideration | Grow your email list |
| CPA | Conversion | Allocate budget to sales |
Clicks can feel rewarding, but without conversions, your budget vanishes into thin air.
Prioritizing Metrics Strategically
Depending on where you are in the buyer’s journey, shift your focus:
- Start with CPC to vet ad creatives and headlines.
- Move to CPL when you need to build a qualified contact list.
- Finally, zero in on CPA to measure what each new customer truly costs.
As you progress:
- Early campaigns aim for lower CPC to prove ad appeal.
- Mid‐funnel benchmarks—around $5–$15 per lead—show list‐building efficiency.
- Ultimately, keep CPA within your target threshold to protect your profit margins.
For a deeper dive into CPL formulas and benchmarks, check out our guide on calculating cost per lead: Learn how to calculate Cost Per Lead
Balancing these metrics creates a healthy flow of budget down the funnel. Focus on the right number at the right time, and you’ll see a clearer path from ad spend to revenue. Next up: attributing and tracking CPA with precision to refine your investment strategy.
Tracking And Attributing CPA Effectively
Accurate CPA measurement rests on two essentials: precise tracking and dependable attribution. Skip either one, and your cost data can send you down the wrong path.
Mapping every interaction helps you understand which touchpoints truly drive conversions. By comparing first-touch versus last-touch, you’ll see exactly where to assign credit.
Exploring Attribution Models
- First-Touch: All conversion credit goes to the first interaction, revealing where initial interest sparked.
- Last-Touch: The final click or ad view earns full credit, spotlighting what actually closed the deal.
- Data-Driven: Algorithms analyze real conversion paths, divvying up credit based on each step’s contribution.
Layering these models uncovers undervalued channels and hidden strengths. With that clarity, you can back the tactics that deliver.
Industry data shows macro trends since the mid-2010s have driven a 60% increase in CPA over five years—and up to a 222% rise over eight years, thanks to stiffer competition and tighter privacy rules. Discover more insights about customer acquisition cost trends on GenesysGrowth.
Practical Setup Tips
Nailing down accurate CPA starts with wiring up the right tools.
- Connect Google Analytics to capture conversions and apply UTM tags.
- Link Facebook Ads Manager, then enable your purchase or lead events.
- Integrate your CRM so every form fill or sale lands in one central system.
A synced CRM stops offline conversions from slipping through the cracks and skewing your CPA.
“Accurate attribution can cut false CPA readings by up to 30%,” notes marketing expert Sarah Lee.
With those streams flowing, you can audit misattributed spend. Yet cross-device journeys and cookie limits still trip up many teams.
Server-side tracking and consistent UTM parameters help you overcome these hurdles. Learn more about attribution models in our article on what is attribution modeling.
| Challenge | Solution |
|---|---|
| Cookie Restrictions | Server-Side Tracking |
| Cross-Device Tracking | Unified User IDs In CRM |
| Underreported Conversions | UTM Parameter Standardization |
Integrating LeadSavvy Pro automates lead capture and slashes response time by over 50%. It pushes Facebook form results straight into your CRM or Google Sheet—no downloads needed.
- Keep UTM parameters consistent across every ad.
- Rely on LeadSavvy Pro alerts to engage prospects within minutes.
- Schedule weekly audits to catch tracking gaps before they inflate CPA.
With each conversion logged and attributed correctly, you gain real confidence in your CPA reports. Stick to these steps, and you’ll see costs stabilize—and ultimately decline—across your channels.
Strategies To Lower Cost Per Acquisition
Imagine your ad budget as water slipping through cracks. Narrowing your audience is like patching those leaks—it means you pay only for the people who really matter.
On Facebook, for example, lookalike audiences mimic your top customers, steering new prospects with similar behaviors right to you. At the same time, exclusion lists act like a filter, keeping unqualified leads out of your pipeline.
- Use lookalike audiences based on your highest-value buyers.
- Apply exclusion lists to remove contacts who already converted.
- Layer demographics and interests to sharpen your targeting.
Creative Testing Strategies
Small tweaks to your ads can spark big drops in CPA. Think of A/B tests as your laboratory for headlines, images, and calls to action. They tell you which ingredients really move the needle.
Always change one variable at a time and measure against your baseline CPA. That way, you’ll know exactly what’s working (and what’s not).
- Swap headlines to track shifts in CTR.
- Test different images that resonate with your audience’s tastes.
- Tweak CTA colors or button text to see which drives more clicks.
Budget Allocation Tactics
Shifting dollars toward your top-performing channels is like putting your strongest runners on a relay team. Weekly CPA reports highlight the winners—so you can pull back from laggards and double down on the stars.
Even a 10% reallocation can lead to noticeable savings. It’s all about moving money where it counts.
Enhance Landing Page UX
A jumbled landing page is like a confusing store layout—it sends visitors packing. By clearing away friction and guiding prospects smoothly, you lift conversion rates and shrink your CPA.
- Cut down form fields to only the essentials.
- Use clear headings and arrows that guide the eye.
- Sprinkle in trust signals—reviews, badges, or testimonials.
Run heatmaps to find where people hesitate, then streamline those spots.
Tracking Process Flow
The chart below maps out how UTM tags, audience modeling, and CRM integration come together for pinpoint CPA tracking.
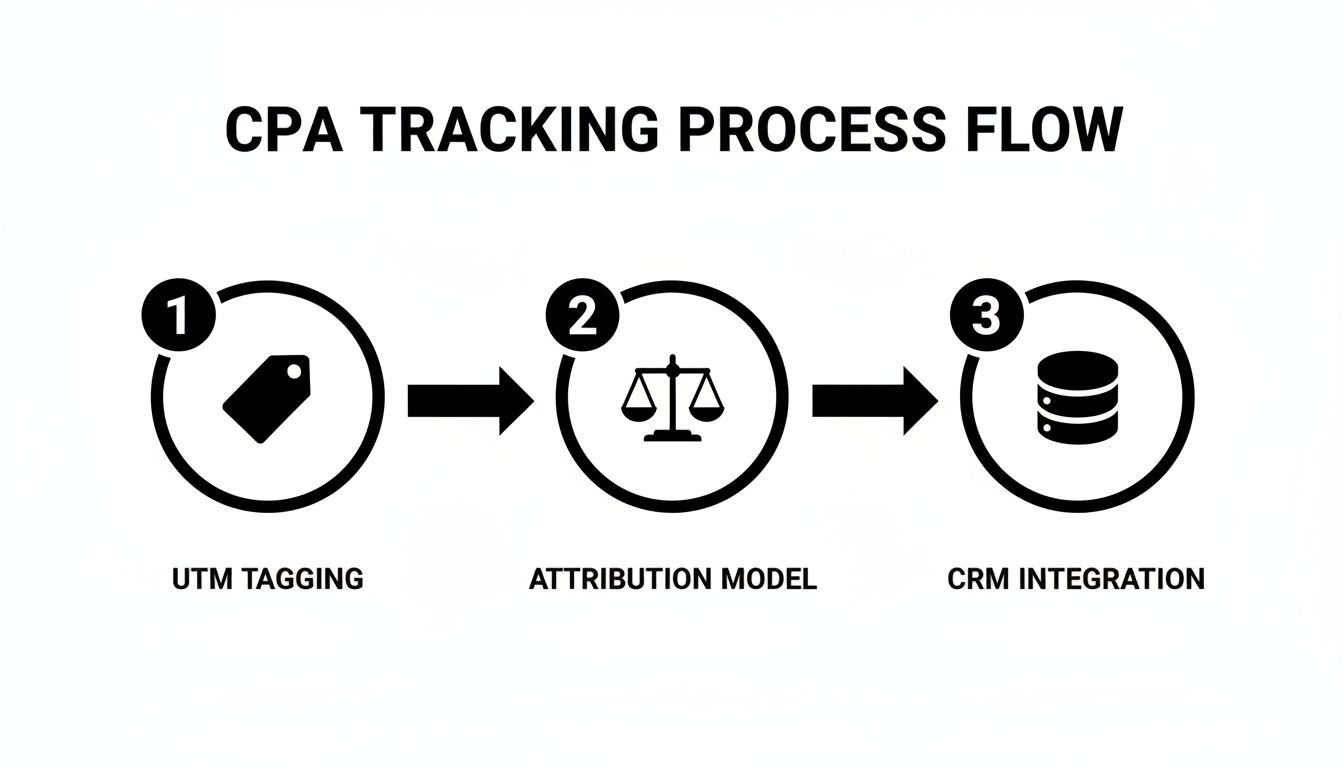
You’ll see a three-step process that feeds real data into your CPA dashboards, making every decision more informed.
Remarketing And Lifecycle Offers
Think of remarketing as a well-timed nudge. By using behavior-based triggers, you can send discount codes or reminders when interest dips, often cutting CPA by 20–25%.
- Automate email triggers for users who’ve gone quiet.
- Send push notifications as timely reminders.
A well-timed sequence can recapture warm leads without the high cost of attracting new ones.
Case Study Example
A SaaS company saw its CPA tumble by 35% after emailing trial users a personalized discount three days post-signup.
“Timely follow-up boosted conversions and reduced wasted spend,” says marketing strategist Alex Chen.
Sales And Marketing Alignment
When sales and marketing speak the same language, leads glide through the funnel faster. Set shared CPA goals, agree on a sub-15-minute response window, and review the pipeline together each week.
- Define common CPA targets.
- Commit to lead response times under 15 minutes.
- Analyze pipeline reports as a team.
Monitoring CPA weekly lets you spot trends before they become problems.
Putting all these tactics to work can drive a sustainable drop in your CPA. And with LeadSavvy Pro, those steps—from tagging leads to sending them into your CRM—are handled automatically, so your team moves faster and smarter.
Improving CPA With Facebook Lead Ads
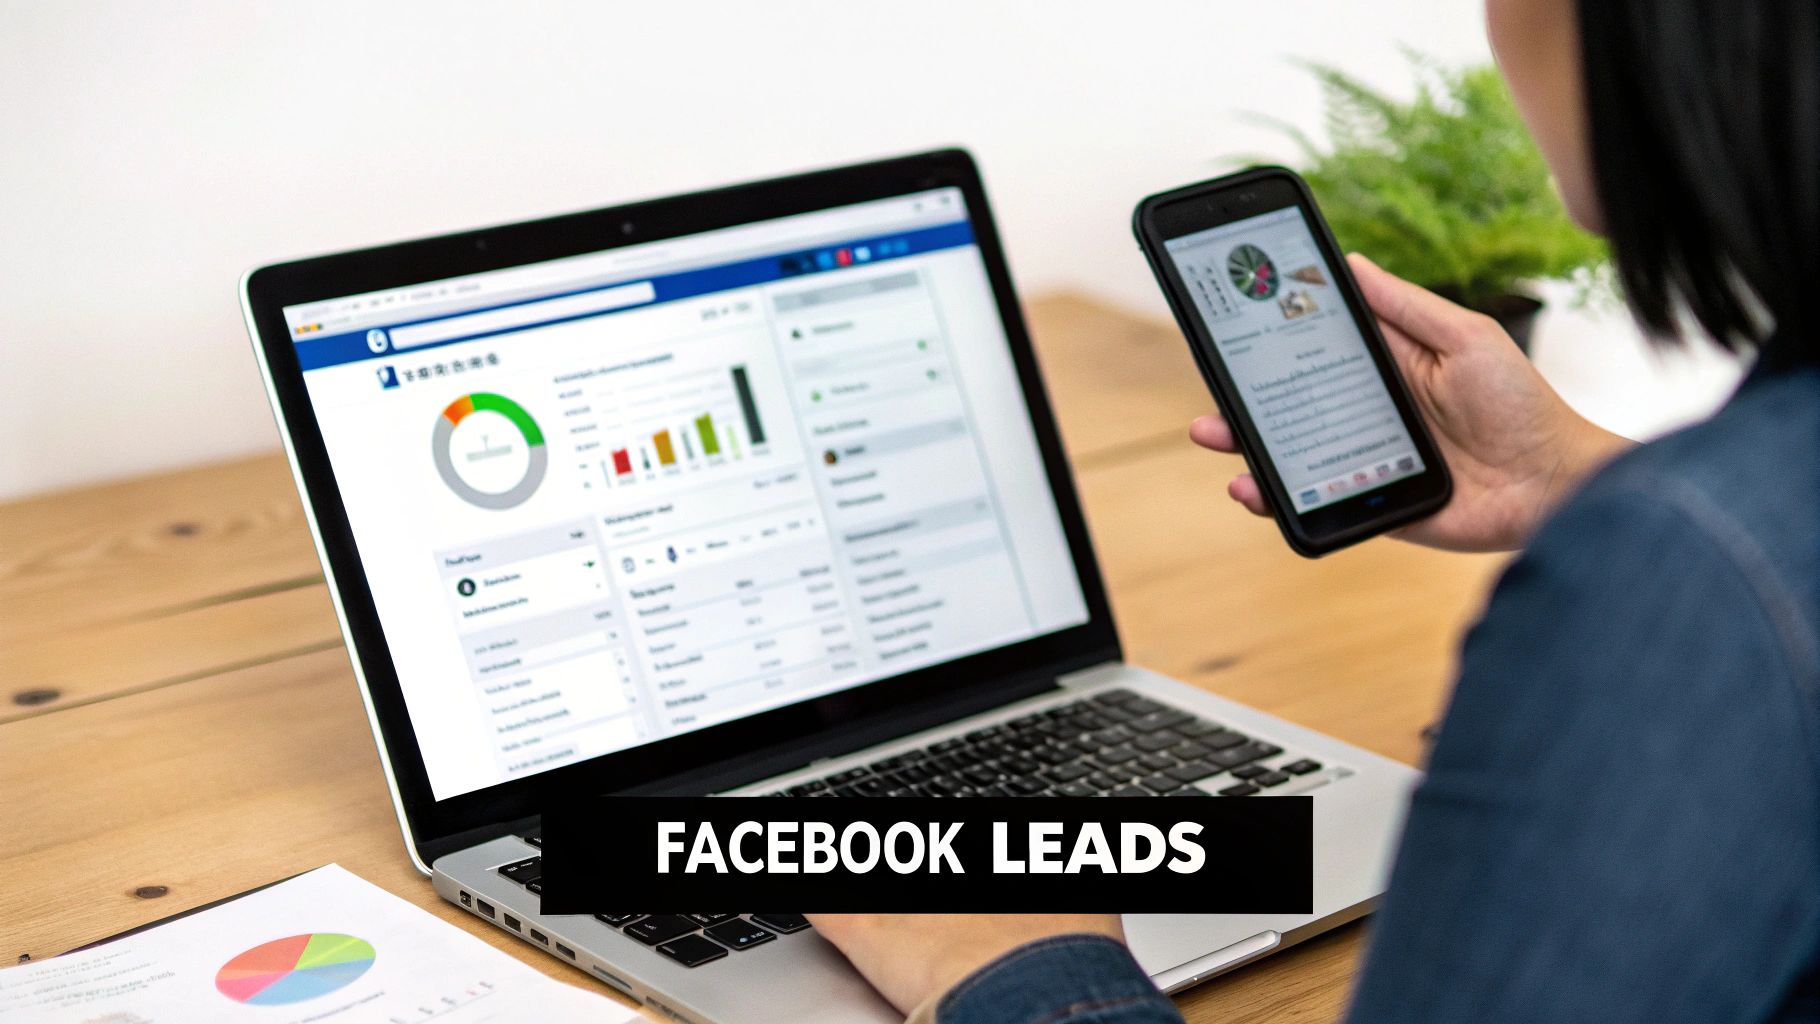
Facebook Lead Ads often outperform standard forms because users stay within the platform. That drop in friction usually drives up conversions while driving down your CPA.
Of course, how low your cost per acquisition falls depends on your bid settings, form layout, and audience build-out.
Mastering Facebook Bidding Strategies
Manual bidding hands you the reins, but you’ll need to review and adjust bids daily to stay on track.
On the flip side, automated bidding taps into Facebook’s algorithm to find as many leads as possible for your set budget.
If you kick things off with a $50 daily spend, monitor your cost per lead over at least seven days.
- Compare Lowest Cost against Bid Cap to see which yields lower CPAs.
- Tweak bids in small increments for more predictable spending.
- Watch ad frequency closely to avoid audience fatigue.
“Automated bids can reduce CPA by up to 15% when paired with clear conversion goals,” says a seasoned marketer.
Designing Forms And Custom Audiences
Think of your lead form as a handshake—the friendlier it feels, the more people will complete it. A shorter form can boost completion rates by 30%.
- Ask only for essentials: name, email, and one qualifying question.
- Use high-contrast buttons and direct labels.
- Include a brief privacy note to build trust quickly.
Then build a 1% lookalike audience from your best customers. This often uncovers fresh leads who behave just like your existing buyers.
- Layer demographics and interests on top of that lookalike for tighter targeting.
Integrating Leads For Instant Follow-Up
Sync every new lead straight into your CRM or Google Sheets using LeadSavvy Pro. Instant alerts let your team reach out within minutes.
Speed matters—following up promptly can cut time-to-contact by 50%, which directly improves conversion odds.
Below is a snapshot of typical CPA ranges across industries to guide your budget planning.
Facebook Lead Ads Benchmark Table
| Industry | Average Facebook CPA |
|---|---|
| eCommerce | $70 |
| Insurance | $1,280 |
| Project-Management Software | $891 |
Use these benchmarks to set realistic targets and keep your ad spend in check.
- Craft forms with only the most critical fields.
- Automate lead syncing with LeadSavvy Pro.
- Test bid strategies and audience segments weekly.
- Retarget warm prospects via Messenger flows.
Check out our guide on creating Facebook Lead Ads in our article: Creating Facebook Lead Ads
By weaving together targeted bids, simple forms, and real-time lead routing, you’ll consistently lower your CPA and sustain growth.
Boost CPA With Messenger And Pixel Retargeting
Your Facebook Pixel acts like a digital breadcrumb trail—follow it to re-engage interested users with tailored ads.
- Trigger a Messenger message as soon as someone completes your form, reinforcing the connection.
Retargeted ads can lower CPA by 20% compared to cold audiences.
Mix these tactics with LeadSavvy Pro notifications so your sales team jumps on hot leads before they cool down.
Cost Per Acquisition FAQ
Tracking CPA doesn’t have to feel like guesswork. Below are the questions I get asked most—along with straightforward answers you can put to work today.
Key Data Points For Accurate CPA
To nail down your CPA, start with two core numbers: total ad spend and the exact count of new customers (or desired conversions). Remember to include:
- Ad creative and production fees
- Platform charges (Facebook, Google, etc.)
- Technology or software subscriptions
- Any agency or consulting costs
Capturing every dollar ensures your CPA reflects the true cost of each acquisition.
Understanding Attribution Models
Attribution can skew your CPA if you’re not careful. Each model divvies up credit in its own way, so your cost metrics can look very different depending on your choice.
- First-Touch highlights the campaign that sparked initial interest
- Data-Driven allocates credit across all interactions
- Model Comparison reveals which channels might be undervalued
By lining up these perspectives, you’ll spot blind spots and fine-tune your budget more accurately.
Negative CPA In Subscription Models
It may seem odd, but CPA can dip below zero in subscription or freemium setups. If refunds or early churn outweigh initial fees, you’re effectively spending more to acquire users than they’re paying in their first billing cycle. That’s your cue to reassess pricing, onboarding, or retention tactics.
When CPA Exceeds CLV
What if your CPA outpaces customer lifetime value? Take action immediately:
- Pause or optimize your highest-cost channels
- Redirect budget toward lower-CPA tactics
- Test new audience segments
- Offer early-stage incentives to boost initial revenue
“Monitoring CPA alongside CLV keeps acquisition profitable and sustainable.”
Automating CPA Tracking
Manual CPA tracking is prone to delays and errors. Look for tools that provide:
- Real-time sync from ad platforms into your CRM
- Automated UTM parameter capture for every lead
- Unified dashboards that include offline conversions
For instance, pushing Facebook form leads directly into your CRM can cut data lag by 50%, speeding up follow-up and reducing wasted spend.
Final Tip
Schedule regular data audits and ensure marketing and sales share the same playbook. The faster you sync data and reach out to prospects, the more reliable—and lower—your CPA will become.
Ready to cut acquisition costs and speed up follow-up? Try LeadSavvy Pro at LeadSavvy Pro