
Measuring Marketing Campaign Effectiveness
So, what does it actually mean to measure marketing campaign effectiveness?
In a nutshell, it's about tracking the right numbers to figure out if your campaigns actually hit their goals and helped the business grow. It’s how you connect the money you spend on marketing to real-world results like leads, sales, and cold, hard revenue.
This whole process is about moving away from guesswork. It lets you prove your value and make smarter decisions for your next campaign.
Why You Absolutely Need to Measure Your Campaigns
Trying to justify your marketing budget without solid data is a fight you'll lose every time.
But this is about more than just showing a simple ROI. Data-driven measurement is what elevates the marketing team from a "cost center" to a legitimate revenue engine. When you know your numbers inside and out, you can make better budget calls, prove your team’s worth to the higher-ups, and get a little better with every campaign you launch.
Think of it as the blueprint for a marketing program that reliably adds to the bottom line.
And the stakes are getting higher. With global marketing spend rocketing to nearly $985 billion—a 9.4% jump year-over-year—companies are investing more, but they're also demanding more bang for their buck.
Firms are putting around 7.7% of their total revenue into marketing, which means the pressure to show a clear return is massive. (If you want to dive deeper into these numbers, Statista.com has some great insights on marketing spend).
The Strategic Edge Measurement Gives You
Getting a solid handle on your campaign performance isn't just about putting numbers on a slide. It's about gaining a real competitive advantage. When you can confidently track what’s working, you unlock some serious benefits that directly boost the health of the business.
Here's what that looks like in the real world:
- Smarter Budgeting: You can finally stop guessing and start shifting resources from channels that are just burning cash to the ones actually bringing in results. You'll make every dollar count.
- Proving Your Value: Clean data lets you draw a straight line from your marketing activities to financial results. You can walk into a meeting and show executives exactly how your campaigns are fueling revenue growth.
- Getting Better Over Time: When you know what works (and what flops), you create a powerful feedback loop. Every campaign becomes a lesson, making the next one smarter and more effective than the last.
Ultimately, measuring marketing is about turning raw data into smart decisions. It’s the secret to turning marketing from a mysterious art into a predictable science, letting you build a growth engine you can count on.
This guide is your roadmap to getting this process right. We’re going to walk through how to set goals that actually matter, pick the right metrics for any campaign, and use the best tools for the job. By the end, you'll be able to confidently answer that all-important question: "Was it worth it?"
Building a Solid Measurement Foundation

Here's a hard truth: if you wait until your campaign is over to figure out how to measure it, you've already failed.
Effective measurement doesn't start with a panicked dive into Google Analytics post-launch. It starts with a deliberate, strategic plan before a single ad dollar is spent. Think of it as your pre-flight checklist. It's the boring but critical work that ensures your campaign actually has a chance of success.
This upfront work completely eliminates guesswork. You stop chasing vague goals like "get more leads" and start defining specific, measurable objectives. A much stronger, actionable goal is, "Increase qualified SaaS demo requests by 20% this quarter through our LinkedIn ad campaign." See the difference?
Aligning Marketing Objectives with Business Goals
Your marketing goals can't exist in a silo. Their real power comes when you tie them directly to what the C-suite actually cares about—broader business outcomes.
If the company's big objective is to break into a new market, your marketing goal might be to generate 50 Marketing Qualified Leads (MQLs) from that specific segment.
This alignment is how you prove your worth. When you can draw a straight line from your team's activities to company-wide success, you fundamentally change the conversation. Marketing stops being a cost center and starts being recognized as a revenue driver.
Here are a couple of real-world examples:
- Business Goal: Increase annual recurring revenue (ARR) by 15%.
- Marketing Objective: Improve the lead-to-customer conversion rate from 2% to 3.5% by overhauling the email nurture sequence for trial users.
- Business Goal: Reduce customer churn by 10%.
- Marketing Objective: Launch a customer onboarding email series that increases product feature adoption by 25% within the first 30 days.
By defining what success looks like before you launch, you create a framework that guides every single decision. You’re no longer just tracking random activity; you're measuring progress toward a meaningful destination.
Selecting Your Key Performance Indicators
Once you know your destination, you need a map to track your progress. That's where Key Performance Indicators (KPIs) come in. These are the specific, quantifiable metrics that tell you if you're on the right track or veering off a cliff.
Please, don't fall into the trap of tracking vanity metrics. Likes and shares are nice for the ego, but they don't pay the bills if your actual goal is to drive sales.
Focus on metrics that directly reflect your objective. If your goal is generating demo requests, your primary KPI is the number of completed demo forms. Simple. Your secondary KPIs might be the Cost Per Lead (CPL) or the conversion rate of your landing page.
For a practical way to get this all organized, check out our detailed marketing campaign tracking spreadsheet. It's built to help you structure and monitor your KPIs effectively.
The digital marketing space is a $667 billion behemoth, and it's built on data. With digital spend now accounting for nearly 72.7% of all ad budgets, metrics like click-through rates and conversions are non-negotiable. As Recurpost points out, this data-first world makes a solid measurement foundation more critical than ever. By choosing the right KPIs from the start, you ensure you're getting clear signals, not just a bunch of noise.
Matching Metrics to Your Campaign Goals
Trying to measure a brand awareness campaign with the same metrics you use for lead generation is a classic mistake. It's like judging a fish by how well it can climb a tree. It just doesn’t work.
The secret to actually understanding your performance is picking the right metrics for the right job. A campaign built to get your name out there needs to be measured on visibility and reach. On the other hand, a campaign designed to make the phone ring needs to be judged on hard numbers—leads, sales, and revenue.
The goal always dictates the metrics. Not the other way around.
Metrics for Brand Awareness Campaigns
When your main goal is building brand awareness, you're playing the long game. Success here isn't about immediate sales; it’s about capturing attention and staying top-of-mind.
You'll want to focus on indicators that show your brand's footprint is growing:
- Social Impressions: This is simply the total number of times your content was shown to users. It's a foundational metric for understanding how far your message is traveling.
- Share of Voice (SOV): How visible is your brand compared to your competitors? A rising SOV means you're starting to own the conversation in your space.
- Brand Mention Trends: Keep an eye on how often people are talking about your brand online. This gives you a real-time pulse on public awareness and sentiment.
The big idea here is to measure your presence and perception. Are more people in your target audience aware of you today than they were yesterday? That's the win. This groundwork sets the stage for all your future conversion-focused campaigns.
Metrics for Direct-Response and Lead Generation
When you need immediate action, your metrics have to be tied directly to dollars and cents. This is where you connect your marketing spend to real business results, which is the core of measuring campaign effectiveness.
Here, the focus shifts completely to efficiency and profitability:
- Customer Acquisition Cost (CAC): How much does it cost you to get one new paying customer? A low CAC is a sign of a healthy, efficient marketing engine.
- Return on Ad Spend (ROAS): This shows you the revenue you earned for every single dollar you spent on ads. A 3:1 ROAS means you generated $3 in revenue for every $1 you invested.
- Customer Lifetime Value (LTV): This metric looks at the bigger picture, predicting the total revenue a customer will bring in over their entire relationship with your brand. When you have a high LTV, you can justify spending more to acquire those valuable customers.
This is where truly understanding what is marketing attribution(https://leadsavvy.pro/post/what-is-marketing-attribution/) becomes a game-changer. It helps you give credit where credit is due, pinpointing the touchpoints that actually drove those valuable conversions.
The infographic below gives a great visual of how a user's actions on your site get translated into the dashboard metrics you use to see what’s working.
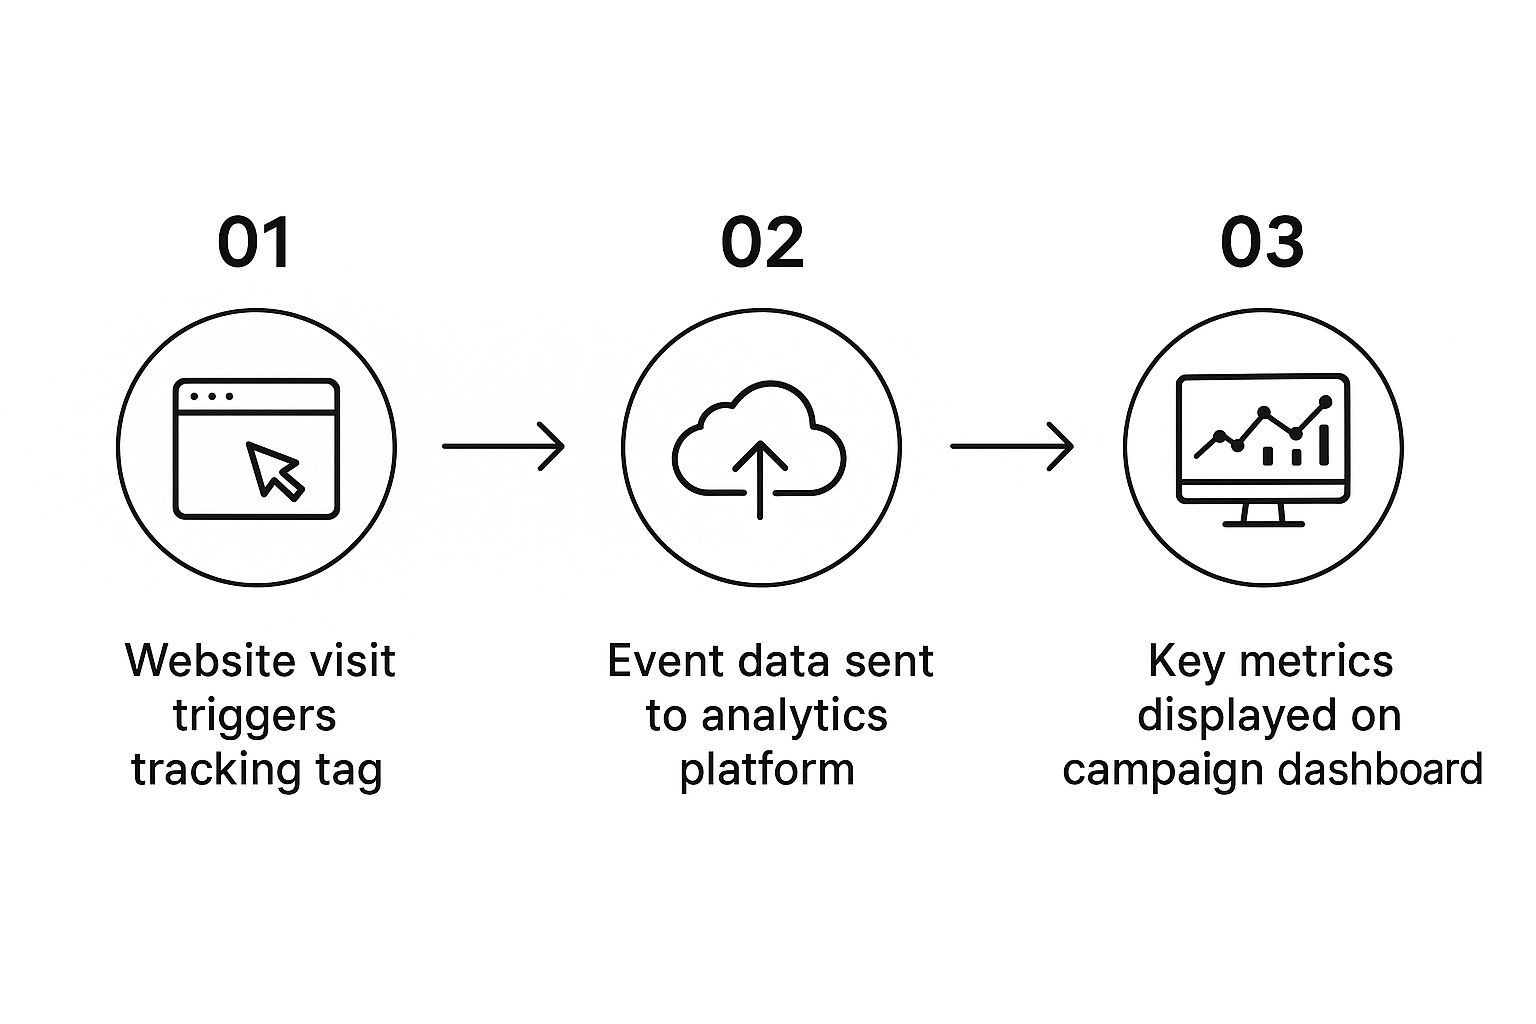
This flow highlights that every click and every conversion is a critical data point. That's why matching it to the right goal is so important for getting an accurate read on performance.
Take social media, for example. We're seeing its effectiveness judged more and more by engagement and ROI. Did you know that user-generated content drives 28% more engagement than standard brand posts? This kind of insight helps you align your social strategy with metrics that actually move the needle.
To help you get this right every time, here’s a quick-reference table that connects common campaign goals with the KPIs that matter most.
Matching Marketing Metrics to Campaign Goals
This table is a clear guide showing which Key Performance Indicators (KPIs) are most relevant for different marketing objectives, helping you focus on what truly matters for each campaign.
| Campaign Goal | Primary KPIs | Secondary Metrics | Example Scenario |
|---|---|---|---|
| Increase Brand Awareness | Impressions, Reach, Share of Voice (SOV) | Website Traffic, Social Engagement (likes, shares), Brand Mentions | A new startup launches a social media campaign to introduce its product to the market. |
| Generate Leads | Cost Per Lead (CPL), Conversion Rate, Number of Leads | Click-Through Rate (CTR), Form Submissions, Demo Requests | A B2B software company runs a LinkedIn ad campaign offering a free ebook to capture email addresses. |
| Drive Sales | Return on Ad Spend (ROAS), Customer Acquisition Cost (CAC) | Average Order Value (AOV), Sales Revenue, Shopping Cart Abandonment Rate | An e-commerce store runs Google Shopping ads to sell a new line of sneakers. |
| Improve Customer Loyalty | Customer Lifetime Value (LTV), Repeat Purchase Rate, Churn Rate | Net Promoter Score (NPS), Customer Satisfaction (CSAT), Engagement with Loyalty Program | An online subscription box service emails a special discount to existing customers to encourage renewals. |
By using this framework, you can ensure you’re always measuring what counts, turning data into actionable insights rather than just noise.
Ultimately, aligning your metrics with your goals brings clarity. When you look at different approaches, like local PPC advertising strategies, you can see clear case studies of how specific goals demand specific metrics. This alignment turns a confusing jumble of numbers into a clear story of your campaign’s success.
Choosing Your Marketing Measurement Toolkit

Having the right data boils down to having the right tools. The good news is that building your measurement tech stack doesn't need to be some complicated, expensive ordeal. What it does need to be is intentional. Your goal here is to build a system that gives you a clear, unified view of your campaign performance without burying your team in spreadsheets.
Starting With The Essentials
For most businesses, the journey begins with the basics. These are the tools that track the core actions people take when they interact with your brand online. Think of these as your non-negotiables.
Your first stop should almost always be Google Analytics. It's free, it's powerful, and it's the industry standard for a reason. GA is your window into understanding website behavior, showing you everything from where your traffic is coming from to which pages are actually turning visitors into leads. It answers the most fundamental questions about what's happening on your most important digital asset.
From there, you need to get familiar with the native analytics inside the platforms where you're running ads. These tools give you channel-specific insights that even Google Analytics can't always perfectly capture.
- Meta Business Suite: This is your command center for Facebook and Instagram ads. It’s where you’ll dive deep into metrics like reach, engagement, and on-platform conversions.
- LinkedIn Campaign Manager: For B2B campaigns, this is your source of truth. It offers granular data on how professionals are engaging with your content and ads.
- Google Ads Platform: The place for all things search, display, and video. You’ll find mission-critical metrics here like click-through rate, cost-per-click, and impression share.
Just by mastering these foundational tools, you can paint a surprisingly clear picture of your campaign performance—all without spending a dime on software.
I see it all the time: businesses invest in a complex, pricey tool before they've even mastered the free ones. Your first priority should be building a solid data-gathering habit with the essentials. The fancy dashboards can wait.
Graduating to More Advanced Systems
As your marketing matures, so will your measurement needs. You'll eventually hit a wall where piecing together data from different platforms becomes a massive time-suck, creating blind spots in the customer journey. That's your cue to upgrade.
A Customer Relationship Management (CRM) system like HubSpot or Salesforce is usually the next logical step. A CRM is what finally connects your marketing spend to actual sales. It lets you follow a lead from their very first click on an ad all the way through to becoming a paying customer, giving you a true end-to-end view of your marketing ROI.
For even deeper insights, specialized attribution software like Ruler Analytics can be a game-changer. These tools are built to solve the puzzle of which marketing touchpoints actually drove a sale. Instead of just giving all the credit to the last click, they help you see the entire sequence of interactions that led to a conversion.
When you're ready to consolidate all your campaign data for robust reporting, you might want to explore some of the top business intelligence platforms. These systems pull data from all your different sources into one place, creating a single source of truth and making it way easier to visualize performance for yourself and your stakeholders. The right BI tool really just depends on your budget, team size, and overall business goals.
Turning Campaign Data Into Actionable Insights
Let's be honest, raw data is just noise. A spreadsheet full of numbers won't do you any good until you translate it into smarter decisions for your next campaign. This is where the magic happens—turning those figures into real-world actions that actually improve your results.
Your goal here is to make spotting trends and opportunities ridiculously easy. You don't need some complex, enterprise-level system. Most of the time, a simple dashboard that visualizes your key metrics is all it takes to see the story your data is telling.
Build a Simple, Visual Dashboard
First things first, pull all your most important KPIs into one place. This can be a free tool like Google Looker Studio or even a well-organized spreadsheet. The point is to see everything at a glance so you can immediately tell what's killing it and what's falling flat.
Your dashboard should be built to answer a few critical questions:
- Performance Trends: Are metrics like Cost Per Lead (CPL) or your overall Conversion Rate heading up or down over time?
- Channel Efficiency: Which channels are giving you the best Return on Ad Spend (ROAS)? Are you putting your money in the right places?
- Audience Resonance: Which ad creative or copy is actually getting clicks and engagement?
A great dashboard doesn't just show you data; it tells you where to focus your attention. It's the difference between drowning in numbers and confidently steering your campaigns in the right direction.
Embrace A/B Testing for Optimization
Once your dashboard helps you spot an opportunity, A/B testing is how you capitalize on it. It’s a simple concept: test one small change at a time to see what your audience really wants. Don't overcomplicate it. Just focus on changes that can make a real impact.
For example, maybe you notice your email click-through rate is tanking. Instead of guessing why, you can test two different subject lines on a small segment of your list. The winner gets sent to everyone else. Easy.
This same idea works for landing page headlines, button colors, ad copy, and calls-to-action. Consistent, methodical testing is the surest way to get those small wins that add up to massive improvements over time.
Conduct a Campaign Post-Mortem
After every big campaign wraps up, you need to run a "post-mortem." This isn't about pointing fingers; it's a structured review to figure out what you learned so you can do better next time. Get your team together and ask three simple questions:
- What Worked? Pinpoint the exact tactics, channels, or messages that crushed your goals. You'll want to double down on these next time.
- What Didn't Work? Be brutally honest about what failed. Was the landing page confusing? Did an ad completely miss the mark with your audience?
- Why Did It Happen? This is the most crucial question. Dig deep to understand the reasons behind your wins and your losses. This is where the real lessons are found.
Documenting all this creates a playbook for your team, ensuring every campaign is smarter than the last. To nail the financial side of your analysis, check out our guide on how to calculate Return on Ad Spend for a clear breakdown of how to tie your budget directly to revenue. This whole process turns every campaign—win or lose—into a valuable learning experience.
Common Questions About Campaign Measurement
Even with the best plan in place, a few practical questions always seem to trip marketers up. Let's get into some of the most common hurdles I see people face and how to clear them, so you can turn that data into real decisions.
How Do I Measure Offline Marketing Campaigns?
This one comes up a lot. Measuring things like print ads, radio spots, or event sponsorships can feel like shouting into the void. But it doesn't have to be.
The trick is to build a clear, trackable bridge from your offline effort to your digital world. You have to give people a unique and easy way to find you online.
Here are a few tactics that work every time:
- Custom URLs: Don't just print your homepage. Create a vanity URL like
yoursite.com/radiothat redirects to a specific landing page. Now you can isolate all traffic from that ad. - QR Codes: These are fantastic for print materials or banners at an event. A quick scan sends someone straight to a campaign page, letting you track every visit and conversion from that source.
- Dedicated Phone Numbers: Using a call tracking service, you can assign a unique phone number to an offline campaign. This is a dead-simple way to attribute every single inbound call to a specific ad.
- Unique Discount Codes: A code like "PODCAST20" tells you exactly how many sales came from that specific podcast sponsorship. It’s direct, simple, and effective.
If your goal is broader brand awareness, you can always run pre- and post-campaign surveys to see if brand recall has shifted. The core idea is always the same: make the offline trackable online.
What Is Marketing Attribution and Why Does It Matter?
Think of marketing attribution as figuring out which of your marketing efforts gets credit for a sale or conversion. It's a huge deal because customers almost never see one ad and immediately buy something.
Their journey is usually a winding path of different interactions across multiple channels.
The old-school 'last-touch' model, which gives 100% of the credit to whatever a customer clicked right before they converted, is dangerously misleading. It might tell you a branded search ad closed the deal, but it completely ignores the social media ad that introduced them to you and the email that nurtured their interest.
Multi-touch attribution models (like linear or time-decay) are designed to spread the credit across the entire customer journey. This gives you a far more realistic picture of what's actually working, helping you put your budget where it will have the most impact.
How Often Should I Review My Campaign Data?
There’s no magic number here. The right frequency for checking your data really depends on the campaign’s speed and how much you're spending.
A good rule of thumb is to match your review cadence to the pace of the channel.
For fast-moving, high-spend campaigns like Google Ads or Facebook Ads, daily check-ins are a must. You need to be able to spot problems and make quick optimizations before you burn through your budget.
For longer-term plays like SEO or content marketing, a weekly or bi-weekly review makes more sense. These results take time to accumulate, so checking daily won't tell you much.
But no matter what you're running, a comprehensive monthly review is non-negotiable. This is your time to zoom out, analyze the big-picture trends, see how you’re tracking against your main KPIs, and make strategic calls for the month ahead.
Tired of manually downloading Facebook leads and wasting valuable time? LeadSavvy Pro automates the entire process, sending your leads directly to a Google Sheet or your CRM the second they come in. Stop juggling CSVs and start converting leads faster by visiting https://leadsavvy.pro.